
Bitcoin gained about 25% in August, then stalled below $81,000 and slipped toward $77,000, a shape some analysts are calling a Bart pattern. Renewed US strikes on Iran have pushed oil higher just as three central banks prepare to meet. One level decides whether the bearish read holds.
What a Bart Pattern Is
A Bart pattern describes price moving sharply in one direction, trading sideways in a narrow range, then snapping back toward where it started. The outline resembles the cartoon character’s hair, and it forms in thin liquidity.
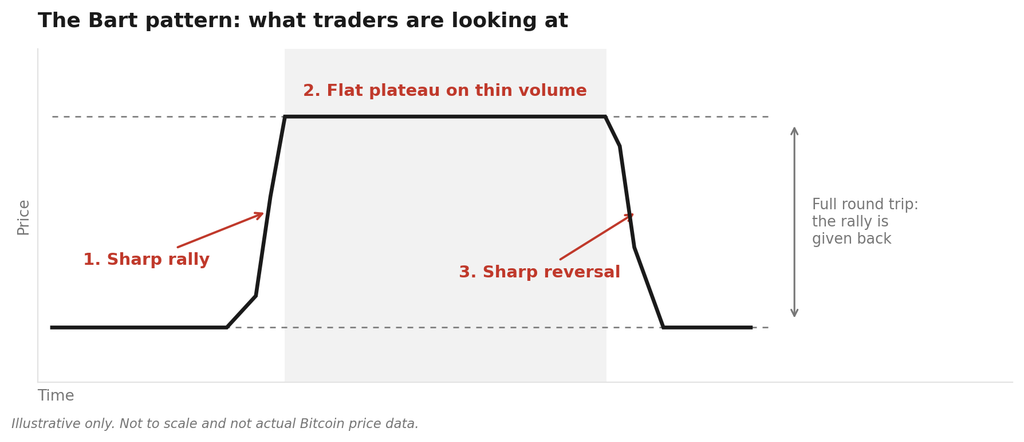
The three phases of a Bart pattern. The chart is illustrative and does not show actual price data.
Bitcoin climbed from roughly $64,420 on 19 August to nearly $80,700 on 25 August, then retreated toward $76,500. Frank Hepworth of New Market Trading reads that shape as distribution, large holders selling into retail buying, and notes the rally stalled at the 50-week average near $81,000.
Other analysts argue the pattern is incomplete unless price gives back the whole move, a fall of at least 20% from the peak, or roughly $64,560. Bitcoin sits 4% below its high, so most of that round trip has not happened.
How Iran Headlines Are Hitting Bitcoin
A fresh round of US airstrikes on Iranian targets, and Iranian retaliation against US bases, pushed oil prices higher this week. Higher energy costs feed into consumer prices and make rate cuts less likely, which is how the conflict affects the price of Bitcoin.
Read our Bitcoin Price Prediction analysis.
Bitcoin ETFs Just Had Their Best Month of 2026
August was the strongest month of 2026 for US spot Bitcoin ETFs, with $3.52 billion of inflows cutting year-to-date outflows from $5.29 billion to $1.77 billion.
Total net assets rose about 31% to $99.61 billion while price gained roughly 25%, so new money entered the funds. September has been choppier, with $236.5 million leaving on 1 September, the largest daily outflow since July, before $101.1 million returned.
The Central Bank Decisions That Dominate September
Three central banks set interest rates within eight days: the European Central Bank on 10 September, the US Federal Reserve on 15 and 16 September, and the Bank of England on 17 September. The Fed meeting also carries the dot plot, the chart showing where officials expect rates to go.
The Fed has held at 3.50% to 3.75% for five straight meetings under chair Kevin Warsh, and FedWatch puts the odds of another hold at 65.2%, leaving a 34.8% chance of a rise. Three of the five 2026 decisions were followed by Bitcoin selloffs, and January saw it fall 7% to $78,700 with $2.4 billion of long positions liquidated.
Bitcoin Confirms the Bart Pattern Below $75,800
$75,800 sits about 2% below spot. A sustained break below it confirms the pattern, while holding above leaves room for Bitcoin to retest $80,000.
Wintermute treats a weekly close under $72,000 as the point where a deeper fall becomes likely. Hepworth sees $70,000 after that, and $58,000 if selling accelerates, and his firm has already cut its Bitcoin position.
Bitcoin has fallen after three of the five Fed meetings this year, which makes the second half of the month the riskier stretch. ETF flows give a daily read until then, and one $236.5 million outflow does not undo the $3.52 billion August brought in. Below $75,800, the Bart pattern is confirmed.
Disclaimer: This article is for informational purposes only and does not constitute investment advice. Crypto assets are unregulated and highly volatile. Readers should conduct their own research before making any trading decisions.
FAQs
1. What is a Bart pattern in crypto?
A Bart pattern is a chart pattern where price rises sharply, holds a narrow sideways range, then falls back toward its starting point. It usually forms in thin liquidity, and analysts often read it as distribution, meaning large holders selling into retail demand.
2. Why is the Bitcoin price falling this week?
Bitcoin is falling because renewed US strikes on Iran lifted oil prices, raising inflation expectations ahead of the Federal Reserve meeting on 15 and 16 September. US spot Bitcoin ETFs also recorded $236.5 million of outflows on 1 September.
3. What level would invalidate the Bitcoin Bart pattern?
Analysts have identified $75,800 as the threshold, about 2% below current levels. Holding above it leaves the bearish pattern unconfirmed and keeps a move back toward $80,000 in play, while a sustained break below would confirm it and open the way toward $70,000.
4. When is the next Fed meeting, and why does it matter for Bitcoin?
The Federal Reserve meets on 15 and 16 September 2026, with the ECB deciding on 10 September and the Bank of England on 17 September. Markets place a 34.8% probability on a Fed rate rise, and three of the five 2026 decisions have been followed by Bitcoin selloffs.