This guide provides a ZAMA crypto price prediction using technical indicators such as RSI, MACD, and moving averages. Explore ZAMA price forecasts for today, this week, and the long term through 2040, along with key support and resistance levels, momentum analysis, and market outlook. Whether you are tracking short-term price action or evaluating future potential, this forecast offers a data-driven view of ZAMA’s expected performance.
ZAMA (ZAMA) is currently trading at $0.0518, up 8.81% on the day and printing a fresh all-time high, as per the latest TradingView chart. The 14-day RSI stands at 85.02, deep into overbought territory, while the 20-day, 50-day, and 100-day EMAs are positioned at $0.03769, $0.03455, and $0.03173, respectively.
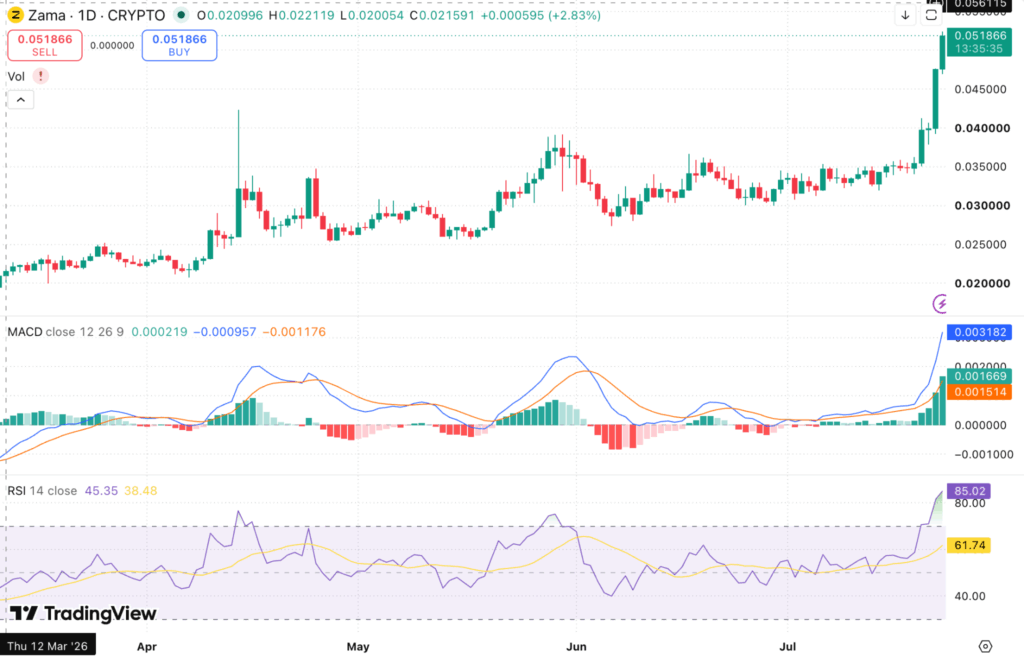
ZAMA/USD, Source TradingView
Key Insights
- Short-term outlook: ZAMA is trading above every moving average on the chart, and the EMAs are stacked in bullish order with the 20-day at $0.03769 sitting above the 50-day at $0.03455 and the 100-day at $0.03173. Because price is at a record, there is no overhead EMA resistance to clear. The first support on any pullback is the day’s low at $0.0469, followed by the old high near $0.0458.
- Medium to long-term outlook: For the ZAMA price prediction 2026, the breakout above the June–July consolidation band is the structural event. Holding above $0.0458 keeps the measured move toward $0.0620 and then $0.0780 in play. Note that the 200-day EMA does not yet exist: the token has only been trading since 2 February 2026, so there is not enough history to calculate it.
- Technical analysis: The MACD line at 0.003182 sits well above the signal line at 0.001514, with the histogram expanding to 0.001669 and both lines firmly above zero. That is about as clean a momentum signal as this indicator produces. The counterweight is RSI at 85.02 against its moving average at 61.74, the most stretched reading on the visible chart.
ZAMA Short-Term Price Prediction – Today, This Week, July 2026
Here is the ZAMA price prediction 2026 for today, this week, and July 2026.
| Timeframe | Price Target | Support | Resistance | ROI |
| Next 24 Hrs | $0.0540 | $0.0469 | $0.0540 | +4.25% |
| This Week | $0.0580 | $0.0458 | $0.0580 | +11.97% |
| July 2026 | $0.0620 | $0.0458 | $0.0620 | +19.69% |
ZAMA Price Prediction Today
ZAMA is trading near $0.0518 after closing 8.81% higher, and could extend toward $0.0540 in the next 24 hours if the breakout holds. Immediate support sits at $0.0469, the day’s low. With RSI above 85, a sideways or modestly red session would be the healthier outcome, since parabolic days rarely follow one another without a pause.
Trade ZAMA in INR on 
Deposit and withdraw in INR (₹).
No Conversion to Crypto Required.

ZAMA Coin Price Prediction for This Week
ZAMA is projected to trade between $0.0458 and $0.0580 this week. The prior record near $0.0458 is the level that matters most: breakouts that hold their old high tend to continue, while those that lose it quickly often turn into failed moves. A daily close above $0.0580 would improve the short-term ZAMAUSD price forecast and open the path toward $0.0620. Losing $0.0458 would suggest the breakout was driven by short-term positioning rather than sustained demand.
ZAMA Price Prediction for July 2026
The ZAMA price prediction July 2026 targets $0.0620, within a range of $0.0458–$0.0620. That target comes from the measured move projected off the June–July base, which spanned roughly $0.030 to $0.038 before price broke out. With about a week of the month left, the more realistic read is that ZAMA consolidates its gains rather than adding another 20%. A monthly close anywhere above $0.0458 would confirm the breakout and leave the structure intact heading into August.
Read more: How to buy Crypto in India
ZAMA Coin Price Prediction for August 2026
ZAMA’s August 2026 price prediction targets $0.0690, with a range of $0.0620–$0.0690. If ZAMA digests this move without surrendering $0.0458, the next leg would likely test the psychological $0.0600 mark before extending. A sustained move above $0.0690 would improve the ZAMA coin price prediction for Q3 2026. On the other hand, a failure back below $0.0458 would put the 20-day EMA at $0.03769 into play as the next meaningful support, a drop of roughly 27% from current levels.
ZAMA Price Prediction 2026 (Medium Term)
| Month | Price Target | Support | Resistance | ROI |
| July 2026 | $0.0620 | $0.0458 | $0.0620 | +19.69% |
| Aug 2026 | $0.0690 | $0.0518 | $0.0690 | +33.20% |
| Sep 2026 | $0.0780 | $0.0580 | $0.0780 | +50.58% |
| Oct 2026 | $0.0880 | $0.0620 | $0.0880 | +69.88% |
| Nov 2026 | $0.1000 | $0.0690 | $0.1000 | +93.05% |
| Dec 2026 | $0.1150 | $0.0780 | $0.1150 | +122.01% |
ZAMA’s 2026 price range is projected at $0.0317–$0.1150, with the 100-day EMA marking the floor of that band and $0.1150 the upper target. The EMA structure is the most constructive of any small-cap privacy token right now: price above all three averages, each one sloping higher, and none of them acting as resistance. The obvious caution is that ZAMA has roughly doubled since March and is overbought on every short-term measure, so the ZAMA price prediction remains bullish on trend while acknowledging that the entry point here is a demanding one.
Want to diversify beyond ZAMA? Check out the Top 10 Cryptos To Invest In July 2026
ZAMA Price Prediction in INR (2026–2030)
For Indian traders, here is what the ZAMA price prediction in INR looks like across the key horizons.
| Period | ZAMA Target USD | ZAMA Price INR est. |
| July 2026 | $0.0620 | ₹5.98 |
| December 2026 | $0.1150 | ₹11.10 |
| 2027 | $0.1600 | ₹15.44 |
| 2030 | $0.4800 | ₹46.32 |
INR estimates based on a USD/INR rate of ~₹96.5. Rate fluctuations will affect actual INR values; verify at the time of trade.
ZAMA Long-Term Price Outlook (2027–2040)
The long-term outlook for ZAMA rests on three structural drivers: whether fully homomorphic encryption moves from research curiosity to default infrastructure, whether protocol fee burn outpaces the roughly 5% staking inflation, and how privacy protocols fare against tightening regulatory scrutiny.
That second point deserves emphasis, because ZAMA has no maximum supply. The token runs on a burn-and-mint model in which 100% of protocol fees are burned while new tokens are minted to reward operators. Net supply therefore depends entirely on usage. Heavy protocol activity makes ZAMA deflationary, while thin activity makes it inflationary at around 5% a year. That makes fee volume, not a fixed supply cap, the number to track.
The following forecasts are derived from network-adoption modelling, comparable privacy-infrastructure valuations, and historical ZAMA volatility patterns. They represent scenario ranges, not price targets.
| Year | Price Target | Support | Resistance | ROI |
| 2027 | $0.1600 | $0.1100 | $0.2200 | +208.88% |
| 2028 | $0.2400 | $0.1600 | $0.3200 | +363.32% |
| 2029 | $0.3400 | $0.2300 | $0.4500 | +556.37% |
| 2030 | $0.4800 | $0.3200 | $0.6500 | +826.64% |
| 2031 | $0.6200 | $0.4200 | $0.8500 | +1,096.91% |
| 2035 | $1.1000 | $0.7500 | $1.5000 | +2,023.94% |
| 2040 | $1.8000 | $1.2000 | $2.5000 | +3,374.90% |
Where Will ZAMA Price Go in 2030?
ZAMA’s 2030 price prediction targets $0.48, within a range of $0.32–$0.65. The scenario assumes that confidential smart contracts become standard for institutional on-chain activity and that fee burn has turned net supply deflationary. Against roughly 11 billion tokens, $0.48 implies a network value in the region of $5 billion, which is ambitious but consistent with what a genuinely adopted privacy layer for Ethereum and Solana could command.
Where Will ZAMA Price Go in 2031?
The ZAMA price prediction for 2031 targets $0.62, with a range of $0.42–$0.85. The metrics worth tracking are total value shielded on the protocol, cumulative ZAMA burned versus minted, and the number of confidential applications live in production.
Where Will ZAMA Price Go in 2040?
By 2040, ZAMA’s price is projected at $1.80, ranging from $1.20 to $2.50, on the assumption that encrypted computation becomes as routine as HTTPS is today, the analogy ZAMA’s own team uses. These are 14-year projections carrying high uncertainty and should be read as scenario ranges, not fixed targets, particularly for a protocol whose supply is uncapped and whose regulatory environment remains unsettled.
ZAMA Technical Analysis
The following indicators were used to derive the ZAMA price analysis above. Each value should be refreshed at the time of publishing.
| Indicator | Value | Signal |
| Relative Strength Index 14-Day RSI | 85.02 | Strongly overbought |
| RSI Moving Average | 61.74 | Momentum well above trend |
| 20-Day EMA | $0.03769 | Support |
| 50-Day EMA | $0.03455 | Support |
| 100-Day EMA | $0.03173 | Support |
| 200-Day EMA | Not yet available | Insufficient trading history |
| MACD (12, 26, 9) | 0.003182 | Strongly bullish above zero |
| MACD Signal / Histogram | 0.001514 / 0.001669 | Momentum expanding |
| Average Trading Volume 24H | Not visible on chart | Update before publishing |
Relative Strength Index RSI
The 14-day RSI is at 85.02, the highest reading on the visible chart and comfortably past the 70 overbought threshold. Its moving average sits far below at 61.74, a gap that confirms how fast this move has developed. Overbought does not mean a top is in, and strong trends can hold elevated RSI readings for weeks. What it does mean is that the risk-reward for a fresh entry at these levels is poor. A cooling of RSI toward 60 while price holds above $0.0458 would be the constructive outcome and would strengthen the bullish ZAMA price prediction. A drop below 50 alongside a loss of $0.0458 would signal the move is over.
Moving Averages 20-Day, 50-Day, 100-Day and 200-Day EMA
ZAMA is trading above its 20-day EMA at $0.03769, its 50-day EMA at $0.03455, and its 100-day EMA at $0.03173, with all three sloping upward and correctly ordered. This is the textbook definition of an uptrend and stands in contrast to most small-cap tokens this year. One caveat worth stating plainly: the 200-day EMA cannot be calculated yet. ZAMA’s token only began trading on 2 February 2026, giving it under six months of history, so any ZAMA price forecast citing a 200-day average is using an incomplete series. The practical long-term reference until then is the 100-day EMA at $0.03173.
MACD Moving Average Convergence Divergence
The MACD line at 0.003182 has pulled sharply away from the signal line at 0.001514, and the histogram has expanded to 0.001669. Both lines are above zero, and the histogram has been building for several sessions rather than spiking in one. That combination usually indicates a trend rather than a single-day squeeze. Traders using the ZAMAUSD price prediction as a framework should watch for histogram contraction as the earliest warning that momentum is fading, since it typically turns before price does.
Volume Analysis
Volume is not rendered on the shared TradingView chart and should be updated from a live market data source before publishing. This matters more than usual here. A breakout to all-time highs on rising volume is a genuine repricing; the same breakout on thin volume is a liquidity event that tends to retrace. Given ZAMA’s 8.81% daily gain, confirming turnover against its recent average is the single most useful check a trader can make before acting on this setup.
FAQs
Q1. What will 1 ZAMA be worth in 2030?
Most price prediction models place 1 ZAMA between $0.32 and $0.65 by 2030, with a base case near $0.48. The outcome depends on whether confidential smart contracts see institutional adoption and whether protocol fee burn outpaces staking inflation over the intervening years.
Q2. Will ZAMA hit $0.10?
Zama has already moved from $0.020 in March to $0.0518 today, so the pace is not unrealistic. It requires the current breakout to hold above $0.0458 and fee-generating activity on the protocol to keep growing.
Q3. Is ZAMA a good investment in 2026?
Q3. Is ZAMA a good investment in 2026?
Whether ZAMA is a good investement depends on your risk tolerance and your entry. ZAMA has arguably the strongest research team and investor list of any small-cap privacy project, and its technology addresses a real problem. But ZAMA is at an all-time high with RSI above 85, which is historically a poor moment to buy in size. The regulatory overhang following the May 2026 cUSDC freeze is a separate and unresolved risk.
Q4. What is ZAMA's all-time high (ATH)?
ZAMA set a record of $0.04581 on 22 July 2026 and has traded above that level since, making the current price the effective all-time high. The token launched on 2 February 2026, so its entire price history spans less than six months, which is worth remembering when interpreting any long-term chart pattern.
Q5. What is ZAMA used for?
The ZAMA token has two core functions: paying protocol fees and staking. Fees apply to verifying zero-knowledge proofs of knowledge, decrypting ciphertexts, and bridging encrypted values between chains, and 100% of them are burned. Operators stake ZAMA to run coprocessors and key management nodes, earning newly minted rewards set at roughly 5% inflation initially and adjustable by governance.
Q6. How high will ZAMA go in 5 years?
By 2031, ZAMA price predictions range from $0.42 to $0.85, with a base case near $0.62.
Q7. Does ZAMA have a maximum supply?
No. ZAMA has a total supply of about 11 billion tokens with roughly 2.2 billion circulating, but no hard cap. Supply expands through staking rewards and contracts through fee burn, so the net direction depends on how heavily the protocol is used. This is a meaningful difference from fixed-supply tokens and should shape how you read any fully diluted valuation figure.
Q8. What is the ZAMA price prediction for 2026 in INR?
At a December 2026 target of $0.1150 and a USD/INR rate near ₹96.5, ZAMA could trade around ₹11.10 by year-end 2026. Indian traders can buy ZAMA directly on CoinDCX in INR without any USD conversion.
Q9. Where can I buy ZAMA in India?
Indian traders can buy ZAMA directly on CoinDCX in INR, with no USD conversion, no international brokerage, and no currency risk from exchange rate movement. ZAMA is available for spot purchase on India's leading FIU-registered digital asset exchange.
Q10. What will ZAMA be worth in 2040?
Long-term adoption models project ZAMA between $1.20 and $2.50 by 2040, with a base case near $1.80. These are high-uncertainty scenario ranges over a 14-year horizon and depend on ZAMA maintaining its lead over competing FHE protocols such as Fhenix and Octra.
Disclaimer
This article is for informational purposes only and does not constitute financial or investment advice. Digital asset markets are highly volatile and prices can change rapidly. Past performance is not indicative of future results. The price predictions above are based on technical and on-chain analysis and should not be construed as investment recommendations. Always conduct your own research before making any trading or investment decisions.