

Orchid price prediction at a glance
Orchid’s short-term price outlook remains bullish but highly volatile. OXT was trading near $0.022 on the analysed daily chart after gaining more than 300% in 24 hours. Holding above $0.020 could support another attempt at $0.0253 and $0.030. A daily close below $0.020 may expose the $0.0152 support zone.
Key takeaways
- OXT surged from approximately $0.005 to above $0.020, supported by a sharp increase in trading volume.
- The price moved above its 20-day, 50-day, 100-day and 200-day exponential moving averages.
- Immediate resistance lies around $0.0253, followed by the rejection zone near $0.030–$0.035.
- Immediate support is located at $0.020–$0.021, while the 200-day EMA near $0.0152 is the most important breakout support.
- The rally appears primarily volume- and momentum-driven. No major new Orchid product launch or partnership had been verified at the time of writing.
- OXT remains vulnerable to profit-taking because its price is considerably above its major moving averages.
OXT price prediction summary
| Period | Bearish scenario | Base scenario | Bullish scenario |
|---|---|---|---|
| Next 24 hours | $0.0152–$0.0200 | $0.0200–$0.0253 | $0.0253–$0.0305 |
| Next 7 days | $0.0092–$0.0152 | $0.0152–$0.0305 | $0.0305–$0.0400 |
| End of 2026 | $0.005–$0.012 | $0.012–$0.035 | $0.035–$0.060 |
| 2030 | $0.003–$0.022 | $0.025–$0.075 | $0.075–$0.150 |
These ranges are scenarios based on chart structure, momentum, liquidity and potential adoption. They are not guaranteed targets.
What is Orchid crypto?
Orchid is a decentralised marketplace for internet bandwidth and other digital services. Its best-known use case is a decentralised virtual private network, or dVPN, through which users can purchase bandwidth from independent providers. OXT is Orchid’s Ethereum-based ERC-20 utility token. Providers stake OXT to advertise their services and compete for traffic in Orchid’s marketplace. A larger stake raises the probability that a provider will be selected, but staking does not automatically guarantee rewards.
Users pay providers through probabilistic nanopayments. Instead of recording every small payment individually on Ethereum, Orchid sends cryptographic “tickets,” only some of which are redeemed onchain. This design enables a pay-as-you-go model while reducing the cost of processing very small payments.
Readers unfamiliar with the project can begin with CoinDCX’s guide to what Orchid and OXT are. Orchid’s bandwidth marketplace also overlaps with the broader DePIN sector.
According to Orchid’s official documentation, OXT staking, stake-weighted provider selection and probabilistic nanopayments are central components of the network.
Why is OXT price rising today?
OXT is rising because a sudden increase in spot-market demand pushed the token through several long-term resistance levels. The breakout attracted momentum traders, while thin liquidity may have magnified each new order. Short-covering may also have contributed, although no single verified fundamental announcement fully explains the rally.
Market trackers recorded an increase of more than 300% in 24 hours and trading volume above $50 million. CoinGecko also displayed no recent project insight explaining the move, supporting the view that the initial breakout was primarily market-driven rather than linked to a newly announced product.
Factors behind the OXT rally
1. Trading volume expanded sharply
OXT’s 24-hour turnover increased to several times its reported market capitalisation on some market-data platforms. This volume-to-market-cap relationship indicates intense short-term speculation. High volume can validate a breakout, but turnover exceeding market capitalisation does not automatically represent new long-term investment. The same OXT tokens can be traded repeatedly during a volatile session.
2. OXT broke above its 200-day EMA
Before the surge, OXT had spent several months below its major moving averages. The rally carried the price above the 200-day EMA near $0.0152 in a single large daily candle. This was a significant technical change. Traders who use moving-average breakouts may have entered after OXT reclaimed its long-term trend indicator.
3. Thin liquidity may have amplified the move
OXT is a comparatively small-cap crypto asset. When order-book liquidity is limited, a sudden increase in demand can move the price much faster than it would for a larger, more liquid asset. This effect works in both directions. Thin liquidity can accelerate a rally, but it can also produce steep declines when traders try to exit simultaneously.
4. Short-covering is possible—but not confirmed
A vertical move can force traders with short positions to buy OXT to close those positions, adding more demand. However, a short squeeze should be treated as a possible contributing factor rather than a confirmed catalyst unless liquidation and open-interest data demonstrate it conclusively.
5. Exchange availability has narrowed
Several exchanges delisted OXT spot trading on 23 April 2026. Reduced availability on a large exchange does not directly explain the present rally, but it may leave liquidity concentrated across fewer venues and make OXT more sensitive to sudden order flow.
OXT Technical Analysis
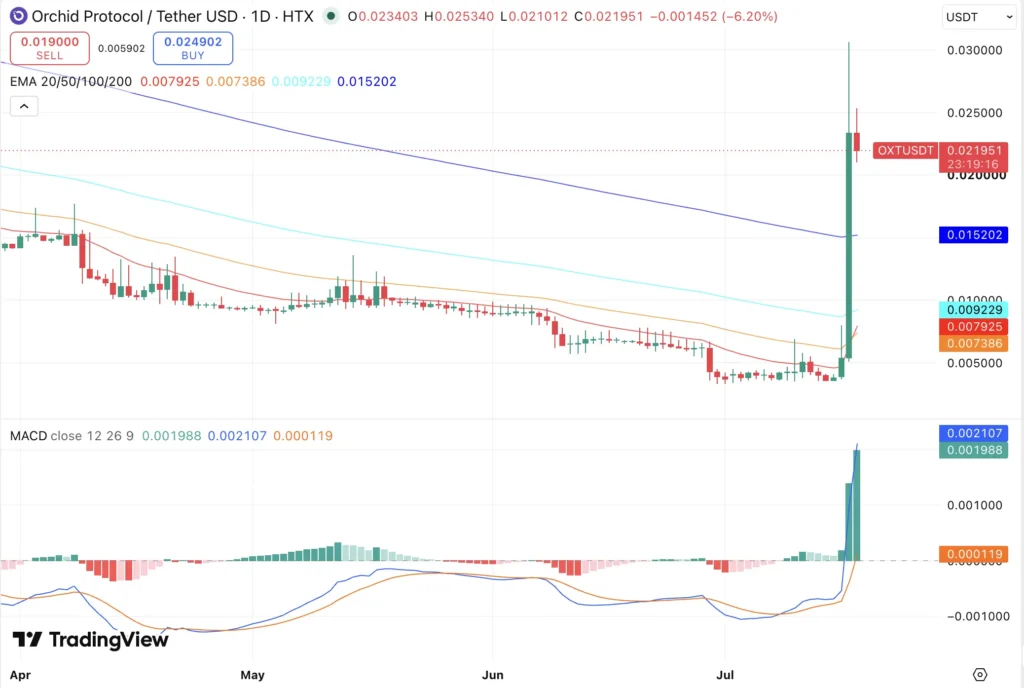
The above OXT/USDT daily chart showed a price of approximately $0.02195 after the token briefly traded above $0.030. The current red candle following the large breakout candle indicates early profit-taking.
OXT moving-average analysis
| Indicator | Approximate value | Interpretation |
|---|---|---|
| 20-day EMA | $0.00793 | Price is heavily extended above its short-term average |
| 50-day EMA | $0.00739 | Short-term trend has turned positive |
| 100-day EMA | $0.00923 | Previous intermediate resistance may become support |
| 200-day EMA | $0.01520 | Most important long-term breakout level |
| OXT price on chart | $0.02195 | Above all four major EMAs |
Trading above every major EMA is bullish. However, OXT was approximately 44% above its 200-day EMA and more than 170% above its 20-day EMA. Such a large separation usually indicates that momentum is strong but the price is also overextended. OXT does not need to return fully to its moving averages, but traders should account for consolidation or a deeper retracement.
Learn more about using exponential moving averages and other crypto trading indicators.
OXT MACD analysis
The daily MACD line moved decisively above its signal line, while the histogram expanded in positive territory. This confirms powerful bullish momentum. Nevertheless, MACD is a lagging indicator. It can remain positive even after the price begins losing momentum. Traders should therefore monitor candlestick closes, volume and support levels alongside MACD.
Read CoinDCX’s detailed guide to using MACD in crypto trading.
Long upper wick signals selling pressure
OXT’s breakout candle reached approximately $0.030–$0.035 before retreating. The resulting upper wick shows that sellers became active near the session high. This does not confirm that the rally is over. It does, however, establish a clear overhead supply zone. OXT will need a strong daily close above this area, not merely another temporary wick, to confirm the next bullish leg.
OXT support and resistance levels
| Type | Price zone | Why it matters |
|---|---|---|
| Immediate resistance | $0.0253 | Current candle high and first recovery hurdle |
| Major resistance | $0.030–$0.035 | Breakout wick and visible rejection zone |
| Extended bullish target | $0.040 | Psychological target if $0.035 becomes support |
| Immediate support | $0.020–$0.021 | Psychological level and latest daily low |
| Major support | $0.0152 | 200-day EMA and breakout confirmation zone |
| Secondary support | $0.0092 | 100-day EMA |
| Deeper support | $0.0074–$0.0079 | 20-day and 50-day EMA region |
Support and resistance are zones rather than exact prices. Traders can use CoinDCX’s guide to identifying crypto support and resistance for additional context.
OXT Price Prediction today
The short-term structure remains constructive while OXT trades above $0.020. If buyers defend this area, the token could retest $0.0253. A decisive move above $0.0253 would put the $0.030–$0.035 supply zone back in focus. A close below $0.020 would weaken the immediate structure. In that case, traders may look toward $0.0152 as the next major support.
Expected short-term range: $0.020–$0.0253
Bullish breakout target: $0.030–$0.035
Bearish invalidation level: Daily close below $0.020
OXT Price Prediction Tomorrow
OXT could remain volatile over the next 24 hours as early buyers take profits and new traders respond to the breakout. The base scenario is consolidation between $0.020 and $0.0253. A high-volume close above $0.0253 could trigger another move toward $0.030. Conversely, failure to recover $0.020 after a breakdown would increase the probability of a pullback toward $0.0152.
Traders should avoid interpreting a single intraday wick as confirmation. Daily closing prices and sustained volume provide more reliable evidence.
OXT Price Prediction this week
For the coming week, $0.0152 and $0.0305 define the wider decision range.
- Bullish scenario: OXT holds $0.020, closes above $0.0305 and targets $0.035–$0.040.
- Base scenario: OXT consolidates between $0.0152 and $0.0305 while its moving averages begin catching up.
- Bearish scenario: OXT loses $0.0152 and retraces toward $0.0092.
Sideways consolidation above $0.0152 could be healthier than another vertical increase. It would allow the market to absorb profit-taking without completely invalidating the breakout.
Orchid price prediction 2026–2030
Long-term crypto forecasts are highly uncertain. Orchid’s future price will depend on real network usage, provider participation, OXT demand, exchange liquidity and the wider crypto cycle. The following forecast uses three scenarios instead of presenting one precise number as inevitable.
| Year | Conservative scenario | Base scenario | Bullish scenario |
|---|---|---|---|
| 2026 | $0.005–$0.012 | $0.012–$0.035 | $0.035–$0.060 |
| 2027 | $0.004–$0.015 | $0.015–$0.045 | $0.045–$0.080 |
| 2028 | $0.004–$0.018 | $0.018–$0.055 | $0.055–$0.100 |
| 2029 | $0.003–$0.020 | $0.020–$0.065 | $0.065–$0.130 |
| 2030 | $0.003–$0.022 | $0.025–$0.075 | $0.075–$0.150 |
Orchid Crypto Price Prediction 2026
OXT could trade between $0.012 and $0.035 under the base scenario. Sustained closes above $0.030, improving liquidity and measurable growth in Orchid usage could open the way toward $0.035–$0.060. If the rally fades and OXT loses its 200-day EMA, a return to $0.005–$0.012 would remain possible.
Orchid Price Prediction 2027
In 2027, the base case places OXT between $0.015 and $0.045. Reaching the upper end would likely require the present breakout to develop into a sustained market trend rather than a temporary volume event. The bullish range of $0.045–$0.080 assumes growing demand for Orchid’s service marketplace and improved exchange liquidity.
Orchid Coin Price Prediction 2028
The 2028 base scenario ranges from $0.018 to $0.055. By this stage, trader interest alone may not be sufficient. OXT would need evidence of continuing utility, active providers and demand for pay-as-you-go privacy or other bandwidth services.
OXT Price Prediction 2029
OXT could trade between $0.020 and $0.065 in the base scenario. A stronger crypto market and growing interest in DePIN projects could lift OXT into the $0.065–$0.130 range, while declining usage could keep it below $0.020.
Orchid price prediction 2030
Our base Orchid price prediction for 2030 is $0.025–$0.075. A bullish scenario could place OXT between $0.075 and $0.150, but this would require sustained adoption and considerably stronger market demand than is currently visible.
The conservative scenario remains as low as $0.003–$0.022 because older small-cap tokens can lose liquidity and relevance if usage does not grow.
What could push OXT price higher?
Growth in decentralised bandwidth demand
Greater demand for decentralised VPNs, private internet access and pay-as-you-go bandwidth could increase the economic relevance of Orchid’s marketplace.
More providers staking OXT
Providers must stake OXT to compete for service requests. An increase in active providers and staked tokens could create utility-linked demand, although staking by itself does not guarantee price appreciation.
Expansion beyond VPN bandwidth
Orchid describes nanopayments as infrastructure capable of supporting bandwidth, storage, API calls and other digital services. Successful adoption beyond the project’s VPN use case could expand OXT’s potential market.
Renewed exchange liquidity
More reliable trading support, tighter spreads and deeper order books could make OXT more accessible. New listings should still be evaluated carefully because listing-related rallies can be temporary.
A broader DePIN market cycle
If investors rotate toward decentralised infrastructure projects, Orchid could benefit from its established brand and functioning payment architecture.
Risks that could push OXT lower
The rally may be speculative
There was no confirmed major product or partnership announcement explaining the full magnitude of OXT’s 300% move. Without follow-through, speculative demand can disappear quickly.
Price is overextended
OXT is substantially above its major moving averages. A return toward the 200-day EMA would represent a large percentage decline even if the broader breakout remained technically valid.
Exchange and liquidity risk
The Binance delisting reduced OXT’s presence on one of the largest global spot exchanges. Lower liquidity can increase slippage and cause rapid price movements in either direction.
Limited evidence of network adoption
OXT’s long-term valuation should ultimately depend on demand for Orchid services and provider activity. Social-media attention and trading volume are not substitutes for measurable ecosystem growth.
Market-data discrepancies
Crypto platforms report different circulating-supply and market-cap figures for OXT. Orchid’s whitepaper specifies a fixed supply of one billion tokens, but traders should verify current circulating supply and venue-specific liquidity before making decisions.
Read more about crypto volatility and ways to manage it.
Trader checklist: What should OXT traders watch next?
Before entering after a sharp rally, traders may want to monitor:
- Whether OXT can hold $0.020 on a daily closing basis.
- Whether volume remains elevated during positive candles but declines during pullbacks.
- Whether $0.0253 is reclaimed with a strong close.
- Whether the $0.030–$0.035 wick zone becomes support rather than producing another rejection.
- Whether funding rates and open interest indicate crowded leverage.
- Whether Orchid publishes a verifiable product, adoption or partnership update.
- Whether spreads and order-book depth are sufficient for the planned position size.
Chasing a vertical candle can expose a trader to poor risk-to-reward. Scaling entries, using invalidation levels and keeping position sizes proportional to liquidity may help manage that risk.
Is OXT crypto a good investment?
OXT is a high-risk crypto asset with a working utility model, a fixed token supply and exposure to the decentralised privacy and DePIN sectors. However, its recent rally appears highly speculative, liquidity is limited and the token remains far below its historical high. Whether OXT is suitable depends on an individual’s risk tolerance, time horizon and ability to absorb losses. A rising price alone does not make a crypto asset a good investment.
Can OXT reach $1?
OXT has previously traded near $1, but returning to that level would require an increase of roughly 40–45 times from a price near $0.022–$0.025. With a fixed total supply of one billion OXT, a $1 token price would imply a fully diluted valuation of approximately $1 billion. That is mathematically possible, but current chart momentum alone does not provide evidence that OXT can sustain such a valuation.
Reaching $1 would likely require substantial growth in Orchid usage, deeper liquidity, broader exchange support and a strong crypto market cycle.
Frequently asked questions
1. What is OXT crypto used for?
OXT is used in Orchid’s decentralised service marketplace. Providers stake OXT to compete for user traffic, while the token supports payments for bandwidth through Orchid’s probabilistic nanopayment system.
2. Why is OXT trending?
OXT is trending after gaining more than 300% in 24 hours and recording a sharp increase in trading volume. The rally appears to be driven by speculative demand, a breakout above long-term moving averages and potentially short-covering.
3. What is the OXT price prediction for tomorrow?
The base-case range is $0.020–$0.0253. A breakout above $0.0253 could target $0.030, while a close below $0.020 could expose support near $0.0152.
4. What is the Orchid price prediction for 2026?
The base scenario places OXT between $0.012 and $0.035 in 2026. A sustained breakout and improving adoption could support $0.035–$0.060, while a failed rally could return OXT to $0.005–$0.012.
5. What is the Orchid price prediction for 2030?
The base Orchid price prediction for 2030 is $0.025–$0.075. The bullish scenario reaches $0.075–$0.150, but depends on significant network adoption and stronger market liquidity.
6. Is OXT an ERC-20 token?
Yes. OXT is an ERC-20 utility token built on Ethereum
7. Does staking OXT guarantee returns?
No. Orchid providers stake OXT to improve their probability of receiving service requests. Orchid’s documentation states that staking does not automatically generate rewards.
Disclaimer: Crypto products and NFTs are unregulated and can be highly risky. There may be no regulatory recourse for losses arising from such transactions. The information in this article is for educational purposes only and does not constitute financial, investment, legal or tax advice. Price predictions are speculative and should not be interpreted as guaranteed outcomes. Past performance does not indicate future results. Readers should conduct independent research, verify current prices and consider their financial circumstances and risk tolerance before trading any crypto asset.