This DigiByte crypto price prediction analyses DGB’s short-, medium-, and long-term outlook using technical indicators such as RSI, MACD, and moving averages. The forecast covers price targets for today, this week, July 2026, and long-term projections through 2040. It also highlights key support and resistance levels, market momentum, and potential scenarios that could influence DigiByte’s future price performance across different market cycles.
DigiByte (DGB) is currently trading at $0.002865, reflecting a bearish market sentiment as of 17 July 2026. The 14-day RSI stands at 34.75, signalling neutral conditions near the oversold zone, while the 50-day and 200-day moving averages are positioned at $0.0029887 and $0.0031108, respectively. The MACD is slightly positive but remains below the zero line, indicating weak bearish short-term momentum. Based on these technical indicators and broader market trends, DGB is expected to consolidate between $0.00280 and $0.00295 in the near term unless buyers reclaim the 50-day EMA.
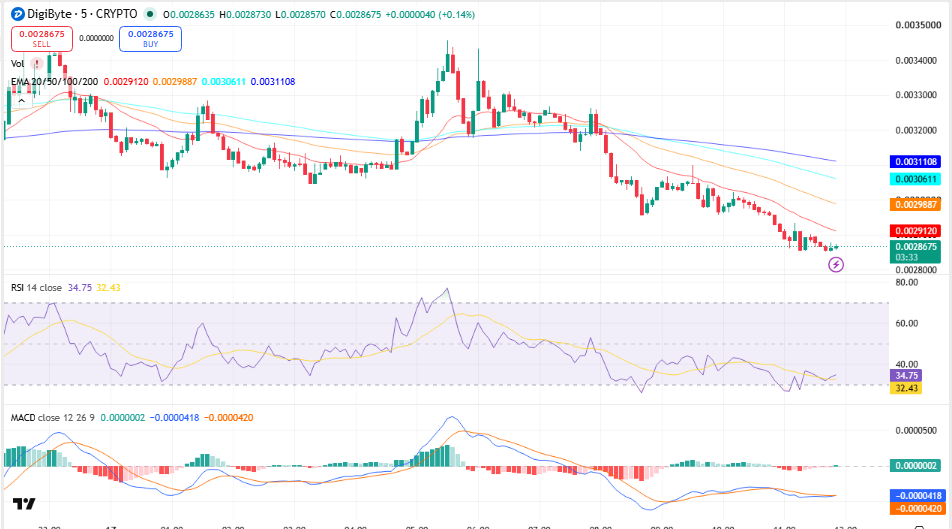
DGB/USDT, Source TradingView
Key Insights
- Short-term outlook: DGB may remain under pressure this week, with resistance near $0.00292-$0.00299 and support around $0.00280.
- Medium-term outlook: A recovery above the 50-day EMA could push DGB toward $0.00310, while failure to hold support may extend losses.
- Long-term outlook: For 2026 and 2030, DGB’s trajectory depends on whether it reclaims its major moving averages and sustains higher lows.
- Technical analysis: DGB trades below its 20, 50, 100 and 200 EMAs, confirming a prevailing bearish trend despite a stabilising RSI and MACD.
DigiByte Short-Term Price Prediction – Today, This Week, July 2026
Here is the DigiByte token price prediction 2026 for today, this week, and July 2026.
| Timeframe | Price Target | Support | Resistance | ROI |
| Next 24 Hrs | $0.00288 | $0.00280 | $0.00292 | +0.52% |
| This Week | $0.00295 | $0.00278 | $0.00299 | +2.97% |
| July 2026 | $0.00305 | $0.00275 | $0.00311 | +6.63% |
DigiByte Price Prediction Today
DigiByte is trading at $0.002865 and is expected to range between $0.00280 and $0.00292 in the next 24 hours. The RSI sits at 34.75 and the 20-EMA at $0.0029120 signals bearish short-term momentum. A hold above $0.00280 targets $0.00292; a break below risks a drop to $0.00275.
DigiByte Coin Price Prediction for This Week
DigiByte is projected to trade between $0.00278 and $0.00299 for the week of 17-24 July 2026. DGB is below the 50-day EMA at $0.0029887, with the MACD histogram contracting, pointing to bearish momentum that may be stabilising. A weekly close above $0.00299 opens $0.00306; a loss of $0.00278 targets $0.00270.
DigiByte Price Prediction for July 2026
DigiByte’s July 2026 price prediction targets $0.00305, with a range of $0.00275-$0.00311. DGB is below its 200-day MA at $0.0031108, and the monthly RSI at 34.75 signals neutral-to-oversold conditions. A monthly close above $0.00311 would confirm bullish momentum heading into Q3 2026.
Trade DGB in INR on 
Deposit and withdraw in INR (₹).
No Conversion to Crypto Required.

DigiByte Coin Price Prediction for August 2026
DigiByte’s August 2026 price prediction targets $0.00312, with a range of $0.00280-$0.00320. DGB is below its 200-day MA at $0.0031108, and the monthly RSI at 34.75 signals neutral conditions. A monthly close above $0.00311 would confirm bullish momentum heading into Q3 2026.
DigiByte Price Prediction 2026 (Medium Term)
| Month | Price Target | Support | Resistance | ROI |
| July 2026 | $0.00305 | $0.00275 | $0.00311 | +6.63% |
| Aug 2026 | $0.00312 | $0.00280 | $0.00320 | +8.90% |
| Sep 2026 | $0.00318 | $0.00285 | $0.00325 | +10.99% |
| Oct 2026 | $0.00325 | $0.00290 | $0.00335 | +13.44% |
| Nov 2026 | $0.00332 | $0.00295 | $0.00345 | +15.88% |
| Dec 2026 | $0.00340 | $0.00300 | $0.00355 | +18.67% |
DigiByte’s 2026 price range is projected at $0.00275-$0.00355. The 200-day MA at $0.0031108 is the key bull/bear line — a hold above targets $0.00355, while a break below $0.00275 risks a drop to $0.00250. Weekly MACD is negative overall, and RSI is trending below the midline, suggesting that bearish momentum still dominates despite signs of short-term stabilisation.
DigiByte Price Prediction 2026 to 2040 (Long Term)
| Year | Price Target | Support | Resistance | ROI |
| 2027 | $0.00380 | $0.00310 | $0.00420 | +32.64% |
| 2028 | $0.00450 | $0.00350 | $0.00520 | +57.07% |
| 2029 | $0.00520 | $0.00400 | $0.00600 | +81.50% |
| 2030 | $0.00600 | $0.00480 | $0.00700 | +109.42% |
| 2031 | $0.00650 | $0.00500 | $0.00780 | +126.88% |
| 2035 | $0.00900 | $0.00700 | $0.01100 | +214.14% |
| 2040 | $0.01500 | $0.01200 | $0.02000 | +423.56% |
DigiByte 2030 Forecast: What Is the Expected Price?
DigiByte price prediction 2030 targets $0.00600, within a range of $0.00480-$0.00700, fuelled by the 2028 halving supply shock and growing network adoption. With most of the supply already mined by then, scarcity could become a key price driver. Stock-to-Flow and Power Law models support a range of $0.00450-$0.00750 under continued network growth.
DigiByte 2031 Outlook and Expected Price Range
The DigiByte price outlook for 2031 targets $0.00650, with a range of $0.00500-$0.00780, as the market enters the post-2028 halving digestion phase. Cycle analysis suggests 2031 could mirror the 2027 pattern—either consolidating from a 2030 peak or building a new base. Long-term holder supply and exchange reserve trends will remain key signals to monitor.
DigiByte Price Prediction 2040: Long-Term Forecast
The DigiByte price forecast for 2040 projects a price of $0.01500, ranging from $0.01200 to $0.02000, as nearly the entire 21 billion DGB supply will have been mined. Metcalfe’s Law and Power Law models point to $0.01200-$0.02000 under moderate adoption, while aggressive scenarios could exceed $0.02500. These forecasts carry high uncertainty and should be viewed as scenario ranges rather than fixed targets.
DigiByte Technical Analysis
The following technical indicators were used to derive the price predictions above. Each indicator’s value and signal should be updated at the time of publishing.
| Indicator | Value | Signal |
| Relative Strength Index (14-Day RSI) | 34.75 | Neutral |
| 50-Day Moving Average | $0.0029887 | Bearish |
| 200-Day Moving Average | $0.0031108 | Bearish |
| MACD | -0.0000418 | Bearish |
| MACD Histogram | +0.0000002 | Positive |
| Average Trading Volume (24H) | $11.81M | Increasing |
Relative Strength Index (RSI)
The 14-day RSI is at 34.75, signalling neutral (30-70) conditions. The indicator is approaching oversold territory, suggesting indecision in the market. The next catalyst will likely determine whether DGB stages a relief rally or extends its downtrend.
Moving Averages (50-Day & 200-Day MA)
DGB is below its 50-day MA at $0.0029887 and below its 200-day MA at $0.0031108. This alignment reflects a sustained downtrend, with the 200-day MA acting as the key resistance level that bulls need to reclaim to confirm a trend reversal.
MACD (Moving Average Convergence Divergence)
The MACD is below the signal line with a histogram of +0.0000002, indicating bearish momentum that is gradually weakening. Momentum is slowing, and a directional break could emerge over the next several trading sessions.
Volume Analysis
DigiByte’s average daily trading volume over the past 24 hours is approximately $11.81 million. Rising volume amid price weakness suggests increased participation and confirms bearish conviction in the current trend, though it may also signal capitulation near support levels.
FAQs
1. Is DigiByte a good investment in 2026?
DigiByte is one of the oldest blockchain networks and is known for its focus on speed, security, and decentralization. The project uses multiple mining algorithms and supports digital assets, smart contracts, and decentralized applications. DGB’s market performance remains closely tied to network adoption, ecosystem development, and broader crypto market trends.
2. What is the all-time high for DigiByte token?
The all-time high price of DigiByte (DGB) was approximately $0.178 to $0.184, reached in May 2021 during the crypto bull market. Since then, the token has traded below its peak value while continuing to maintain an active community and long-standing presence in the blockchain industry.
3. What is the price of a DigiByte token?
As of July 2026, DigiByte (DGB) is trading around $0.0028 depending on the exchange and market activity. The token has recently shown moderate trading volume and price fluctuations. Like most cryptos, DGB’s live price changes frequently throughout the day because of liquidity conditions and investor activity.
4. Who is the founder of DigiByte coin?
DigiByte was founded by Jared Tate, who created the project in late 2013 and officially launched the blockchain in January 2014. Tate developed DigiByte to improve on Bitcoin’s speed, security, and scalability, making it one of the earliest and longest-running blockchain networks in the crypto industry.
Disclaimer: This article is for informational purposes only and does not constitute financial or investment advice. Crypto markets are highly volatile. Always do your own research (DYOR) before making any investment decisions.