


Explore the Janction price prediction with detailed daily, weekly, and long-term JCT forecasts from 2026 to 2040. Analyze current price trends, RSI levels, MACD signals, EMA movements, support, and resistance zones to understand possible market scenarios. This Janction future price prediction guide covers short-term momentum, medium-term expectations, and long-term outlook based on technical indicators and available chart data.
Janction (JCT) is currently trading at $0.00611, reflecting a bearish short-term market sentiment as of June 11, 2026. The 14-day RSI stands at 34.39, signaling slightly oversold conditions, while the 50-day and 200-day moving averages are positioned at $0.00657 and $0.00642, respectively. The MACD is negative, indicating bearish short-term momentum. Based on these technical indicators, JCT is expected to consolidate near current levels with a possible retest of support around $0.00600, while recovery attempts may face resistance near $0.00640-$0.00660.
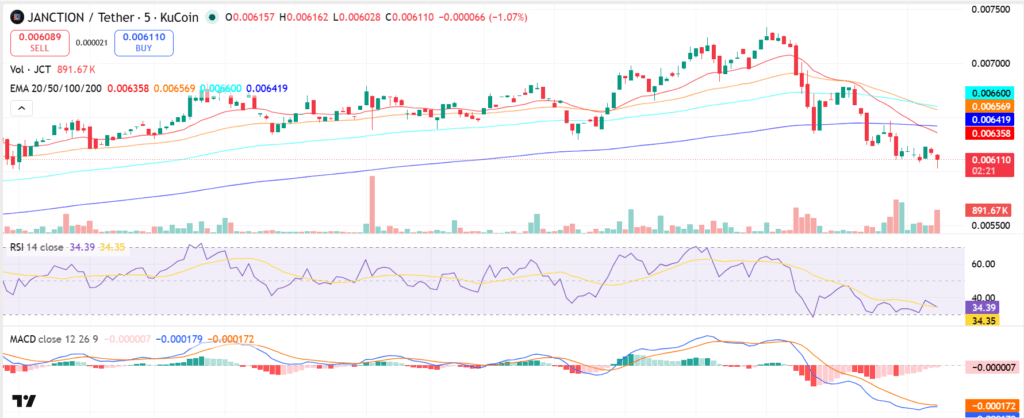
JCT/USDT, Source TradingView
Key Insights
● Short-Term Outlook: JCT may trade sideways to slightly lower this week as price remains below key EMA levels. A breakout above the $0.00640-$0.00660 zone could improve momentum.
● 2026 & Long-Term View: The 2026 outlook depends on whether JCT can reclaim major moving averages. Sustained weakness below support could delay recovery toward higher targets.
● Technical Analysis: RSI near 34 suggests selling pressure has cooled, but MACD remains negative, showing that bears still have control in the short term.
Janction Short-Term Price Prediction – Today, This Week, June 2026
Here is the JCT coin price prediction 2026 for today, this week, and June 2026.
| Timeframe | Price Target | Support | Resistance | ROI |
| Next 24 Hrs | $0.00600 | $0.00590 | $0.00620 | -1.8% to +1.5% |
| This Week | $0.00615 | $0.00580 | $0.00660 | -5% to +8% |
| June 2026 | $0.00640 | $0.00550 | $0.00680 | -10% to +12% |
Janction Coin Price Prediction Today
Janction is trading at $0.00611 and is expected to range between $0.00600 and $0.00620 in the next 24 hours. The RSI sits at 34.39, showing that JCT is approaching oversold territory. The 20 EMA at $0.00636 signals bearish short-term momentum as price remains below the indicator. A hold above $0.00600 could allow JCT to target $0.00620, while a break below this support risks a decline toward $0.00580-$0.00590.
Janction Coin Price Prediction for This Week
Janction is projected to trade between $0.00580 and $0.00660 for the week. JCT is below the 50-day EMA at $0.00657, with the MACD histogram remaining negative but showing early signs of contraction, suggesting that selling pressure may be slowing. A weekly close above $0.00660 could open the path toward $0.00680, while losing $0.00580 may expose the token to lower support zones.
Janction Price Prediction for June 2026
Janction’s June 2026 price prediction targets $0.00640, with a range of $0.00550-$0.00680. JCT is below its 200-day MA at $0.00642, and the RSI near 34.39 signals near-oversold conditions. A monthly close above $0.00660 would strengthen bullish momentum, while continued trading below the 200-day MA may keep the broader trend under pressure.
Trade JCT in INR on ![]()
Deposit and withdraw in INR (₹).
No Conversion to Crypto Required.

Janction Price Prediction for July 2026
Janction’s July 2026 price prediction targets $0.00650, with a range of $0.00580-$0.00700. JCT remains close to its 200-day MA at $0.00642, and the RSI trend suggests improving conditions if buyers regain control. A monthly close above $0.00680 could confirm stronger recovery momentum heading into Q3 2026.
Janction Price Prediction 2026 (Medium Term)
| Month | Price Target | Support | Resistance | ROI |
| June 2026 | $0.00640 | $0.00550 | $0.00680 | -10% to +12% |
| July 2026 | $0.00650 | $0.00580 | $0.00700 | -5% to +14% |
| Aug 2026 | $0.00670 | $0.00600 | $0.00720 | -2% to +18% |
| Sep 2026 | $0.00690 | $0.00620 | $0.00740 | +1% to +21% |
| Oct 2026 | $0.00710 | $0.00640 | $0.00760 | +5% to +25% |
| Nov 2026 | $0.00730 | $0.00650 | $0.00780 | +8% to +28% |
| Dec 2026 | $0.00750 | $0.00680 | $0.00800 | +10% to +30% |
Janction’s 2026 price range is projected at $0.00550-$0.00750 based on the current chart structure. The 200-day MA at $0.00642 remains the key bull/bear level — a hold above this zone could target $0.00680-$0.00750, while a break below $0.00580 support risks further downside. The MACD remains negative, while RSI is trading below the neutral 50 level, indicating that JCT needs stronger buying volume to confirm a trend reversal.
Janction Price Prediction 2026 to 2040 (Long Term)
| Year | Price Target | Support | Resistance | ROI |
| 2027 | $0.0078 | $0.0065 | $0.0090 | +27% |
| 2028 | $0.0095 | $0.0075 | $0.0110 | +55% |
| 2029 | $0.0115 | $0.0090 | $0.0140 | +88% |
| 2030 | $0.0140 | $0.0100 | $0.0170 | +129% |
| 2031 | $0.0160 | $0.0120 | $0.0200 | +162% |
| 2035 | $0.0250 | $0.0180 | $0.0320 | +309% |
| 2040 | $0.0400 | $0.0300 | $0.0550 | +554% |
Janction 2030 Forecast: What Is the Expected Price?
Janction’s 2030 price prediction targets $0.0140, within a range of $0.0100-$0.0170, based on long-term adoption potential and broader market recovery cycles. Current chart data shows JCT trading near $0.00611, with price below major moving averages, meaning future growth depends on reclaiming key resistance zones. The Janction price prediction 2030 remains dependent on stronger volume inflows, improved momentum, and a sustained move above the $0.00660 resistance area. Current technical structure suggests that long-term upside requires a transition from bearish momentum toward accumulation.
Janction 2031 Outlook and Expected Price Range
The Janction price prediction for 2031 targets $0.0160, with a range of $0.0120-$0.0200, as long-term buyers may attempt to push JCT toward higher valuation levels. Current indicators show RSI near 34.39, suggesting weak momentum but potential recovery conditions if buying pressure increases. The Janction price outlook will depend on whether JCT can maintain support zones and recover above its moving averages.
Janction 2040 Long-Term Forecast
By 2040, Janction’s price is projected at $0.0400, ranging from $0.0300 to $0.0550, under a moderate adoption scenario. The current chart indicates that JCT needs to establish stronger bullish momentum before entering a sustained growth phase. Long-term forecasts carry high uncertainty and should be considered scenario-based estimates rather than fixed targets. The Janction price forecast depends on future ecosystem development, market demand, liquidity, and overall crypto market conditions.
Janction Technical Analysis
The following technical indicators were used to derive the price predictions above. Each indicator’s value and signal should be updated at the time of publishing.
| Indicator | Value | Signal |
| Relative Strength Index (14-Day RSI) | 34.39 | Slightly Oversold |
| 50-Day Moving Average | $0.00657 | Bearish |
| 200-Day Moving Average | $0.00642 | Bearish |
| MACD | -0.000179 | Bearish |
| MACD Histogram | -0.000007 | Negative |
| Average Trading Volume (14-Day) | 891.67K JCT | Increasing |
Relative Strength Index (RSI)
The 14-day RSI is at 34.39, signaling near-oversold conditions. RSI remains below the neutral 50 level, showing that sellers currently have more control. A move below 30 could indicate stronger oversold conditions, while a recovery above 50 would suggest improving buying momentum.
Moving Averages (50-Day & 200-Day MA)
JCT is below its 50-day MA at $0.00657 and below its 200-day MA at $0.00642. Trading below both moving averages indicates a weaker trend structure, with both levels acting as resistance. A recovery above $0.00642-$0.00657 would be important for confirming short-term strength.
MACD (Moving Average Convergence Divergence)
The MACD is below the signal line with a histogram value of -0.000007, indicating bearish momentum. The negative MACD structure suggests continued selling pressure, although the shrinking histogram indicates momentum may be slowing. A bullish crossover would be required to confirm a trend reversal.
Volume Analysis
Janction’s trading volume is currently around 891.67K JCT, showing increased activity during recent price movements. Higher volume near support could confirm accumulation, while declining volume during recovery attempts may indicate weak conviction and possible consolidation.
FAQs
1. Is Janction a good investment in 2026?
Janction is an AI-focused Layer-2 blockchain that provides decentralized GPU computing, storage, and resource-sharing services for AI applications. The project aims to support scalable AI infrastructure through blockchain technology. JCT’s market performance remains closely connected to AI ecosystem adoption, network development, and overall crypto market conditions.
2. What is the all-time high for Janction crypto?
The all-time high price of Janction (JCT) was approximately $0.0121, recorded in November 2025 following increased market interest after its launch. Since then, the token has traded below its peak value while continuing to expand its AI computing and decentralized infrastructure ecosystem.
3. What is the price of a Janction token?
As of June 2026, Janction (JCT) is trading around $0.006, depending on the exchange and current market activity. The token has recently shown active trading volume and short-term price fluctuations. Like most cryptos, JCT’s live price changes frequently throughout the day because of liquidity conditions and investor activity.
4. Who is the founder of Janction coin?
Janction was developed by the team behind Jasmy and is closely associated with JasmyLab. As of now, the project has not publicly identified an individual founder. Instead, Janction is presented as a collaborative initiative focused on decentralized AI infrastructure, GPU computing, and blockchain-based resource sharing.
Disclaimer: This article is for informational purposes only and does not constitute financial or investment advice. Crypto markets are highly volatile. Always do your own research (DYOR) before making any investment decisions.

