INJ breaks out above every EMA as RSI hits 73.13, with $7 now the line that matters.
This Injective crypto price prediction analyzes INJ’s short, medium, and long-term outlook using RSI, exponential moving averages, volume, and current market trends. Discover price forecasts for today, this week, September 2026, and projections through 2030 and 2040. The analysis highlights key support and resistance levels, technical indicators, and potential upside scenarios to help investors better understand Injective’s future price direction.
Injective (INJ) is currently trading at $6.45, up roughly 60% from its August low near $4.03 and reflecting a strongly bullish market sentiment as of 8 September 2026. The 14-day RSI stands at 73.13, signaling overbought conditions, while the 50-day and 200-day EMAs are positioned at $5.02 and $5.04, respectively. Price now sits roughly 23% above its 20-day EMA at $5.23, a stretch that usually resolves through either a pause or a shallow retracement. Based on these technical indicators and broader market trends, INJ is expected to test resistance near $6.71 while holding support around $6.15 in the near term.
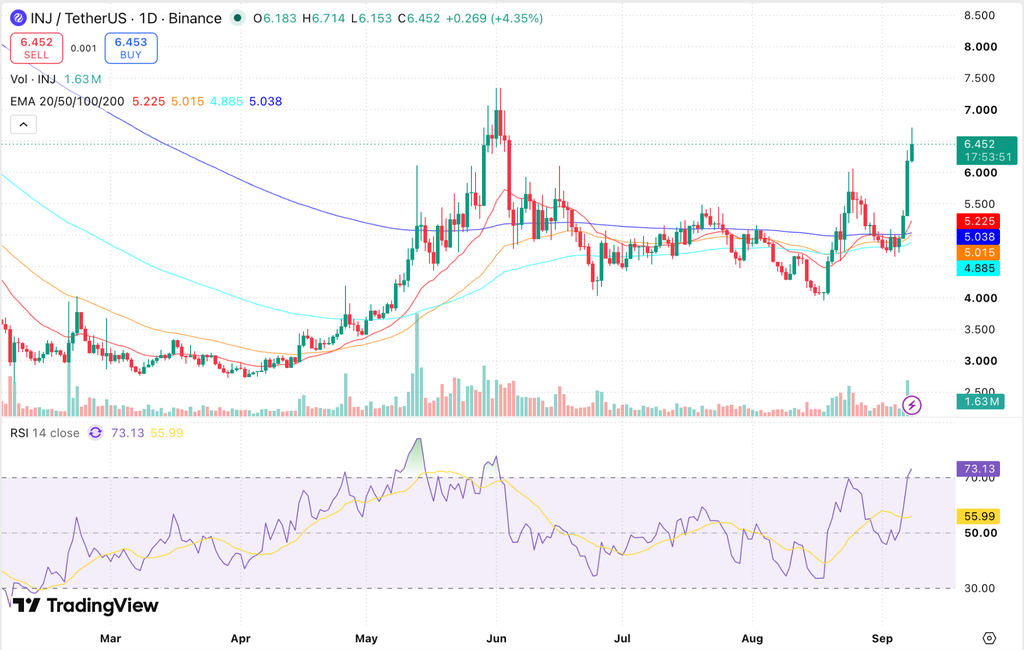
INJ/USDT, Source TradingView
Key Insights
- Weekly Outlook: INJ has cleared its entire EMA stack in a single session and could retest $7.00 if buying pressure holds. Immediate support lies near $6.15, with the $6.00 breakout shelf directly beneath it.
- Monthly and 2026 Outlook: Through September and the remainder of 2026, INJ may work between $5.75 and $8.20, provided the $6.00 level holds on any pullback.
- 2030 Outlook and Technicals: The setup is bullish but stretched, with RSI at 73.13 and the 50-day and 200-day EMAs converging just below spot. Long-term upside depends on Injective converting its tokenization and regulatory wins into sustained on-chain revenue.
Trade INJ in INR on 
Deposit and withdraw in INR (₹).
No Conversion to Crypto Required.

Injective Short-Term Price Prediction – Today, This Week, September 2026
Here is the Injective coin price prediction 2026 for today, this week, and September 2026.
| Timeframe | Price Target | Support | Resistance | ROI |
|---|---|---|---|---|
| Next 24 Hrs | $6.71 | $6.15 | $6.71 | +4.0% |
| This Week | $7.00 | $6.00 | $7.00 | +8.5% |
| September 2026 | $7.35 | $5.75 | $7.35 | +13.9% |
Injective Price Prediction Today
Injective is trading at $6.45 after a 4.35% daily gain and is expected to range between $6.15 and $6.71 in the next 24 hours. The RSI at 73.13 has pushed into overbought territory and the 20-EMA at $5.23 now sits far beneath spot, confirming how quickly this move was built. A hold above $6.15 targets $6.71; a break below risks a drop to $6.00.
Injective Coin Price Prediction for This Week
Injective is projected to trade between $6.00 and $7.00 for the week of 8-15 September 2026. INJ reclaimed its 50-day EMA at $5.02 and its 200-day EMA at $5.04 in one session, and daily volume of 1.63 million INJ is running roughly double the pace of the preceding fortnight. A weekly close above $6.71 opens $7.00; a loss of $6.00 targets $5.48.
Injective Price Prediction for September 2026
Injective’s September 2026 price prediction targets $7.35, with a range of $5.75-$7.35. INJ is trading well above its 200-day EMA at $5.04, and the monthly RSI at 73.13 signals overbought conditions that more often resolve sideways than through an immediate reversal. A monthly close above $7.00 would bring the June swing high of $7.34 into play heading into Q4 2026.
Injective Coin Price Prediction for October 2026
October puts INJ’s ceiling at $7.60 and its floor at $6.00. That floor is the area which capped INJ through late August, and it becomes the first line of defense once the breakout matures, with the 20-day EMA likely tracking just beneath it. A monthly close above $7.34 would clear the highest print of 2026 and shift the structure toward $8.20.
Injective Price Prediction 2026 (Medium Term)
| Month | Price Target | Support | Resistance | ROI |
|---|---|---|---|---|
| Sep 2026 | $7.35 | $5.75 | $7.35 | +13.9% |
| Oct 2026 | $7.60 | $6.00 | $7.60 | +17.8% |
| Nov 2026 | $7.90 | $6.40 | $7.90 | +22.4% |
| Dec 2026 | $8.20 | $6.70 | $8.20 | +27.1% |
Injective’s 2026 price range is projected at $5.75-$8.20, driven by the monthly Community BuyBack burn program and a tokenization pipeline that now runs on SEC-registered transfer agent infrastructure. Pineapple Financial has moved more than $1 billion in residential mortgage records onto Injective and is targeting its full $10 billion loan book, the kind of real-world asset flow that has been repricing mid-cap Layer 1s all year. The $6.00 breakout shelf is now the bull/bear line, a hold above targets $8.20, while a break below risks a retest of $5.48. Daily RSI is elevated but has not yet diverged from price, which favors continuation over exhaustion.
Read more: Injective Staking Hits a Record 58.8M as INJ Coin Price Jumps 12%
Injective Price Prediction 2026 to 2040 (Long Term)
| Year | Price Target | Support | Resistance | ROI |
|---|---|---|---|---|
| 2027 | $10.50 | $8.40 | $11.50 | +62.7% |
| 2028 | $13.50 | $11.00 | $14.80 | +109.2% |
| 2029 | $16.50 | $13.80 | $18.00 | +155.7% |
| 2030 | $20.00 | $17.00 | $22.00 | +210.0% |
| 2031 | $18.50 | $15.50 | $20.50 | +186.7% |
| 2035 | $30.00 | $26.00 | $33.00 | +365.0% |
| 2040 | $48.00 | $42.00 | $53.00 | +644.0% |
Injective 2030 Forecast: What Is the Expected Price?
The Injective price prediction 2030 targets $20.00, within a range of $17.00-$22.00, fueled by a hard-capped 100 million INJ supply that shrinks with every monthly buyback. More than 7 million INJ has already been permanently burned and over 56 million INJ is staked, leaving a thin liquid float relative to any sustained demand shock. Supply-adjusted valuation and Power Law models support a range of $17.00-$22.00 under continued network growth.
Injective 2031 Outlook and Expected Price Range
The Injective price outlook for 2031 targets $18.50, with a range of $15.50-$20.50, as the market digests whatever peak 2030 delivers. Cycle analysis suggests 2031 may mirror the 2026 pattern, either consolidating from a prior high or building a new base beneath it. Staked supply and monthly Community BuyBack volumes will be the key on-chain signals to monitor.
Injective price prediction 2040: Long-Term Forecast
The Injective price forecast for 2040 projects an average price of $48.00, ranging from $42.00 to $53.00, as cumulative burns push the circulating supply meaningfully below the 100 million cap. Metcalfe’s Law and Power Law models point to $42.00-$53.00 under moderate adoption, while aggressive scenarios could exceed $60.00. The upper end of that range would take INJ back to its record high of $52.62 from March 2024, so these forecasts should be viewed as scenario ranges rather than guaranteed outcomes.
Injective Technical Analysis
The following technical indicators were used to derive the price predictions above.
| Indicator | Value | Signal |
|---|---|---|
| Relative Strength Index (14-Day RSI) | 73.13 | Overbought |
| 20-Day EMA | $5.23 | Bullish |
| 50-Day EMA | $5.02 | Bullish |
| 200-Day EMA | $5.04 | Bullish |
| Daily Trading Volume (INJ/USDT) | 1.63M INJ | Expanding |
Relative Strength Index (RSI)
The 14-day RSI is at 73.13, above the 70 overbought threshold and well clear of its signal line at 55.99. Readings this high mark strong trends about as often as they mark tops, so the more useful read is that the odds of a pause have risen. The next catalyst will decide whether INJ digests the move sideways or hands back part of the breakout.
Exponential Moving Averages (50-Day and 200-Day EMA)
INJ is trading above every EMA on the daily chart: the 20-day at $5.23, the 50-day at $5.02, the 100-day at $4.89 and the 200-day at $5.04. The 50-day is closing on the 200-day at roughly four cents a session, so a Golden Cross is likely to print within days rather than weeks. The signal worth watching is whether it holds once momentum cools, not whether it arrives. The distance between spot and the 20-day EMA is the caution flag, since a mean-reversion move is more likely than not, and a pullback that holds $6.00 would leave the breakout structure intact.
Volume Analysis
Injective’s daily volume on the INJ/USDT pair is 1.63 million INJ, among the heaviest readings since the late-August rally and roughly double the pace of the preceding two weeks. Rising participation alongside a price advance confirms conviction behind the move and raises the probability of trend continuation. Volume that fades while price holds near its highs would be the first sign the breakout is losing sponsorship.
Disclaimer
Crypto products and NFTs are unregulated and can be highly risky. There may be no regulatory recourse for any loss from such transactions. This content is for informational purposes only and does not constitute investment advice.
FAQs
What will the Injective Protocol be worth in 2025?
The Injective price could trade around $42 to $45 in 2025
What will be the price of 1 INJ in 2030?
The price of 1 INJ may be around $80 to $95 in 2030.
Will the Injective Protocol price ever hit $100?
The market conditions may turn bullish ahead, which may lift the INJ price close to the $100 milestone in the future.
Is Injective Protocol a safe investment?
The Injective price has been respecting crucial support for a long time and hence can be considered a safe investment with proper research and deep price analysis.