


This Siren Crypto Price Prediction analyzes SIREN’s short-term and long-term potential using key technical indicators, including RSI, MACD, and moving averages. With SIREN trading above its 50-day and 200-day moving averages and maintaining bullish momentum, this forecast covers price targets for today, this week, 2026, 2030, and beyond through 2040.
Siren (SIREN) Price Prediction 2026, 2027-2030 and Beyond
Siren (SIREN) is currently trading at $0.7271, reflecting a bullish market sentiment as of June 4, 2026. The 14-day RSI stands at 51.33, signaling neutral conditions, while the 50-day and 200-day moving averages are positioned at $0.7145 and $0.6712, respectively. The MACD remains positive at 0.00334, although it is trading below the signal line, indicating that bullish momentum is weakening in the short term. Based on these technical indicators and broader market trends, SIREN is expected to test resistance near $0.75 while maintaining support above $0.71 in the near term.
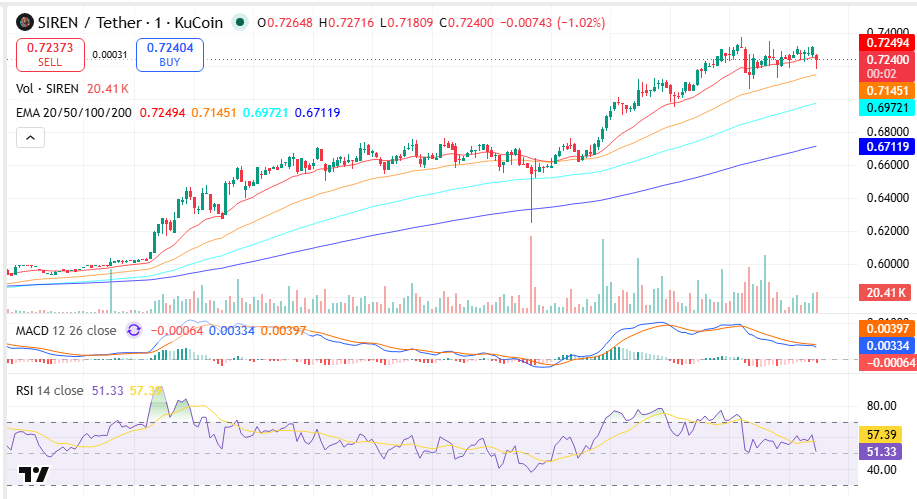
SIREN/USDT, Source TradingView
Key Insights
● Short-term outlook remains positive, with SIREN trading above its 50-day EMA and targeting the $0.75 resistance zone this week.
● June-July 2026 forecasts remain constructive, provided price holds above the $0.71 support area and maintains momentum above key moving averages.
● Technical Analysis: RSI at 51.33 indicates balanced momentum, while a positive MACD and price above the 200-day EMA confirm the broader uptrend remains intact.
Siren Short-Term Price Prediction – Today, This Week, June 2026
Here is the Siren Token price prediction for today, this week, and June 2026.
| Timeframe | Price Target | Support | Resistance | ROI |
| Next 24 Hrs | $0.735 | $0.715 | $0.750 | +1.1% |
| This Week | $0.750 | $0.714 | $0.760 | +3.1% |
| June 2026 | $0.780 | $0.697 | $0.800 | +7.3% |
Siren Coin Price Prediction Today
Siren is trading at $0.7271 and is expected to range between $0.7181 and $0.7272 in the next 24 hours. The RSI sits at 51.33 and the 50-EMA at $0.7145 signals bullish short-term momentum. A hold above $0.7145 targets $0.7500; a break below risks a drop to $0.6972.
Siren Coin Price Prediction for This Week
Siren is projected to trade between $0.714 and $0.760 for the week of June 4-10, 2026. SIREN is above the 50-day EMA at $0.7145, with the MACD histogram remaining negative at -0.00064, indicating that bullish momentum is weakening despite the broader uptrend. A weekly close above $0.7500 opens $0.7600; a loss of $0.7140 targets $0.6972.
Siren Coin Price Prediction for June 2026
Siren’s June 2026 price prediction targets $0.780, with a range of $0.697-$0.800. SIREN is above its 200-day MA at $0.6712, and the current RSI reading of 51.33 signals neutral conditions. A monthly close above $0.8000 would confirm bullish momentum heading into Q2 2026.
Siren Coin Price Prediction for July 2026
Siren’s July 2026 price prediction targets $0.800, with a range of $0.714-$0.820. SIREN is above its 200-day MA at $0.6712, and the current RSI reading of 51.33 signals neutral conditions. A monthly close above $0.8200 would confirm bullish momentum heading into Q3 2026.
Siren Price Prediction 2026 (Medium Term)
| Month | Price Target | Support | Resistance | ROI |
| June 2026 | $0.780 | $0.697 | $0.800 | +7.3% |
| July 2026 | $0.800 | $0.714 | $0.820 | +10.0% |
| Aug 2026 | $0.820 | $0.720 | $0.850 | +12.8% |
| Sep 2026 | $0.840 | $0.730 | $0.870 | +15.5% |
| Oct 2026 | $0.860 | $0.740 | $0.890 | +18.3% |
| Nov 2026 | $0.880 | $0.750 | $0.910 | +21.0% |
| Dec 2026 | $0.900 | $0.760 | $0.930 | +23.8% |
Siren’s 2026 price range is projected at $0.697-$0.930, driven by sustained trend strength visible on the current chart structure. The 200-day MA at $0.6712 is the key bull/bear line — a hold above targets $0.900, while a break below $0.671-$0.697 risks a drop to $0.640. The MACD remains positive at 0.00334 while RSI holds above the 50 level, supporting a constructive trend outlook.
Siren Price Prediction 2026 to 2040 (Long Term)
| Year | Price Target | Support | Resistance | ROI |
| 2027 | $1.05 | $0.80 | $1.20 | +44.4% |
| 2028 | $1.35 | $1.00 | $1.50 | +85.7% |
| 2029 | $1.60 | $1.20 | $1.80 | +120.0% |
| 2030 | $2.00 | $1.50 | $2.30 | +174.9% |
| 2031 | $1.85 | $1.40 | $2.10 | +154.3% |
| 2035 | $3.20 | $2.40 | $3.80 | +339.9% |
| 2040 | $5.50 | $4.00 | $6.50 | +656.1% |
Read also: How to buy Siren coin in India
Where Will Siren Price Go in 2030?
Siren price prediction 2030 targets $2.00, within a range of $1.50-$2.30, supported by the strong uptrend visible on the current chart and continued adoption momentum. Based on the current technical structure, a sustained move above long-term resistance levels could extend gains toward the upper end of the projected range. Based on the current trend structure and long-term projection scenario, SIREN could trade within the $1.50-$2.30 range.
Where Will Siren Price Go in 2031?
The Siren price forecast for 2031 targets $1.85, with a range of $1.40-$2.10, as the market potentially enters a consolidation phase following a strong advance. Cycle analysis suggests 2031 may mirror a post-rally digestion period, either consolidating from a previous peak or establishing a new support base. Long-term trend strength and market participation will remain key factors to monitor.
Where Will Siren Price Go in 2040?
By 2040, Siren price outlook projects an average value of $5.50, ranging from $4.00 to $6.50. The forecast assumes continued ecosystem growth, increasing utility, and broader crypto adoption. Trend-based valuation models point to a range of $4.00-$6.50 under moderate adoption scenarios, while aggressive growth cases could exceed $7.00. These forecasts carry high uncertainty and should be read as scenario ranges, not fixed targets.
Siren Technical Analysis
The following technical indicators were used to derive the price predictions above. Each indicator’s value and signal should be updated at the time of publishing.
| Indicator | Value | Signal |
| Relative Strength Index (14-Day RSI) | 51.33 | Neutral |
| 50-Day Moving Average | $0.7145 | Bullish |
| 200-Day Moving Average | $0.6712 | Bullish |
| MACD | 0.00334 | Bullish |
| MACD Histogram | -0.00064 | Negative |
| Average Trading Volume (30-Day) | 20.41K SIREN | Increasing |
Relative Strength Index (RSI)
The 14-day RSI is at 51.33, signaling neutral (30-70) conditions. The indicator is positioned near the midpoint, suggesting indecision between buyers and sellers. The next major catalyst will likely determine the short-term direction of the trend.
Moving Averages (50-Day & 200-Day MA)
SIREN is above its 50-day MA at $0.7145 and above its 200-day MA at $0.6712. This alignment reflects bullish macro momentum and confirms that the broader uptrend remains intact while price continues to hold above key moving-average support levels.
MACD (Moving Average Convergence Divergence)
The MACD is below the signal line (0.00397) with a histogram of -0.00064, indicating that bullish momentum has weakened and a short-term bearish crossover is in effect. The converging MACD lines suggest momentum is moderating, and a directional break could emerge over the coming sessions.
Volume Analysis
The latest trading volume displayed on the chart is approximately 20.41K SIREN. Volume remains healthy relative to recent sessions and continues to support the prevailing trend. Rising volume generally supports trend continuation and confirms market participation behind the recent price advance.
FAQs
1. What is the all-time high of Siren Coin?
The all-time high (ATH) of Siren (SIREN) refers to the highest price the coin has ever reached on public exchanges. This record price is commonly tracked on major crypto data platforms like CoinMarketCap and CoinGecko. You can check the exact figure and date by visiting those sources or tracking the SIREN price chart history.
2. Siren Price Prediction 2030
Siren price predictions for 2030 are long-term forecasts based on market sentiment, technological adoption, and broader crypto trends. Analysts typically use technical models, historical price action, and macro conditions to project where SIREN might trade by 2030. Long-term forecasts can vary widely and should be considered with caution due to crypto market volatility.
3. When is the launch date of SIREN coin?
The SIREN coin was launched on public markets after the protocol released its token mechanics and distribution model. The launch date is recorded on SIREN’s official documentation and token listing announcement, and can be verified on platforms like Etherscan or the official Siren website.
4. What is the Siren price prediction?
A general Siren price prediction provides short to medium-term expectations for how SIREN might perform based on technical indicators, market trends, and sentiment. These predictions often consider support/resistance levels, trading volume, and broader altcoin cycles. Like all crypto forecasts, they are not guaranteed and are subject to change with market conditions.
5. What is the SIREN coin price?
The SIREN coin price refers to the current market value of SIREN in real-time, typically quoted in USD or pairing tokens like USDT. You can view the live SIREN price on major crypto data aggregators, exchanges where SIREN is listed, and portfolio trackers. Prices fluctuate frequently due to trading activity and broader crypto market movements.
What is the news around SIREN crypto?
SIREN crypto news includes the latest developments, exchange listings, partnerships, protocol upgrades, community developments, or market movements involving SIREN. Staying updated through major crypto news outlets, Twitter/X, and official project channels helps you follow the latest momentum and trends affecting SIREN.
Disclaimer: This article is for informational purposes only and does not constitute financial or investment advice. Crypto markets are highly volatile. Always do your own research (DYOR) before making any investment decisions.

