
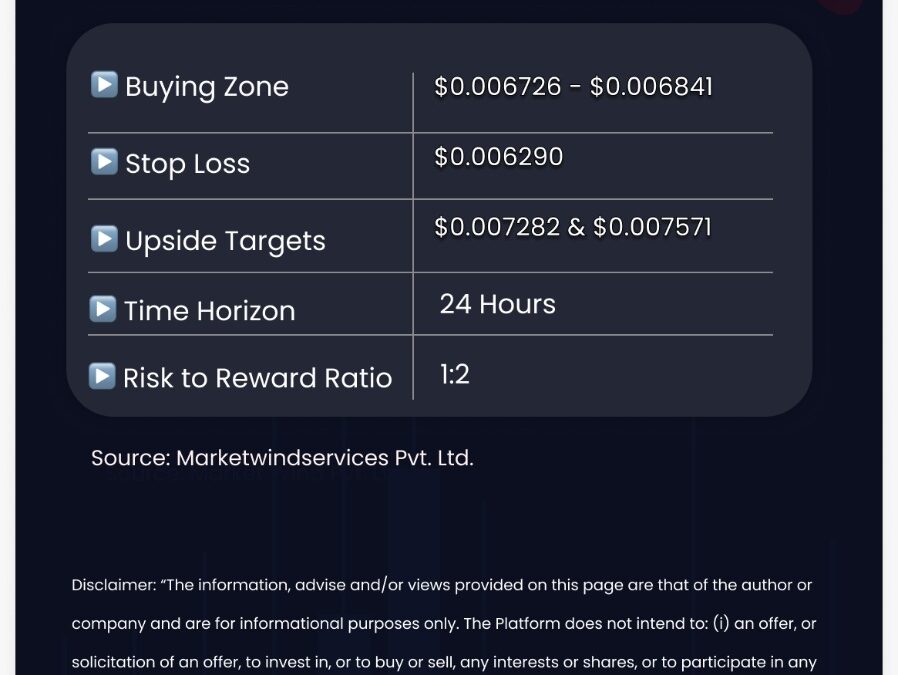


Technical Chart:
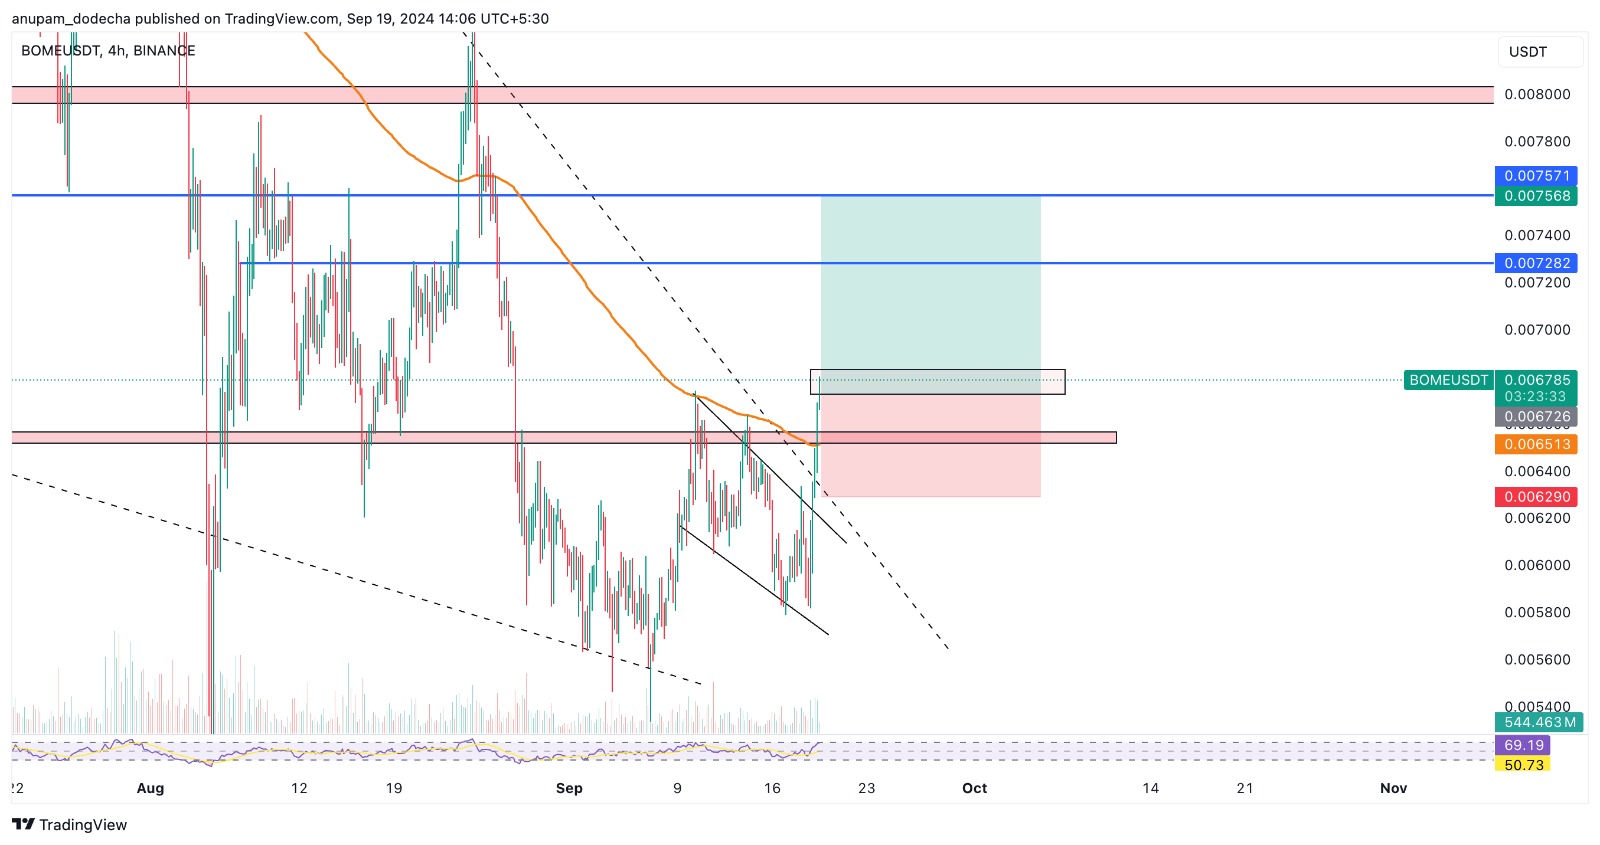
Analysis:
- The overall market is bullish, and BOME has broken out of a falling wedge pattern with an uptick in volume. Additionally, a bullish RSI divergence on higher time frames (HTF) and a reclaim above the 200 EMA on the 4-hour chart signal that BOME is set for a strong upside move.

