 Macro Overview
Macro overview
Although this week did not have major macro announcements that brought volatility, it is important to note some key developments that could impact inflation and play a key role in future interest rate hikes. This week witnesses announcements related to the UK Consumer Price Index (CPI), Eurozone Consumer Price Index (CPI), US Initial Jobless Claims, and US Retail Sales.
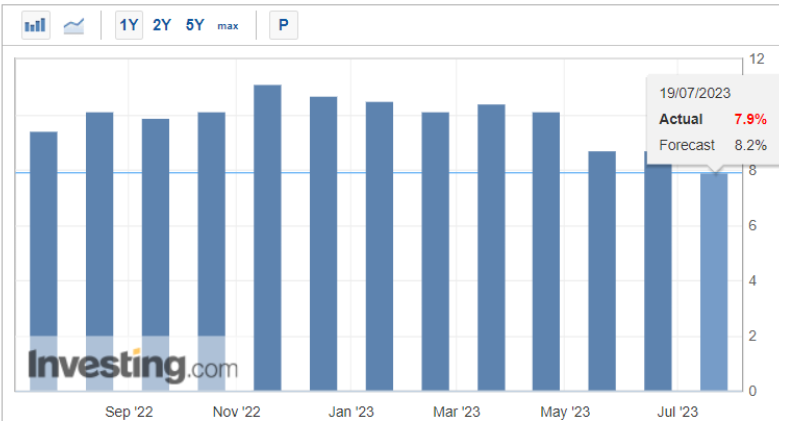
- The UK CPI (YoY) for June revealed that inflation in the United Kingdom continues to cool, reaching 7.9%, slightly lower than the estimated 8.2%. This is bullish for crypto.
UK Consumer Price Index (CPI)
- Eurozone CPI (YoY) for June stood at 5.5%, in line with the expectations and below the previous data of 6.1% for May. This reading is positive for the crypto space.
- US Initial jobless claims that measures the number of individuals who filed for unemployment insurance for the first time during the past week came at 228K, lower than the estimate of 242K. This is also seen as an encouraging sign for crypto, since the dollar is inversely correlated to crypto.
- US Retail Sales (MoM) for June stood at 0.2%, lower than the estimate of 0.5%. This measures the change in the total value of sales at the retail level. It is the foremost indicator of consumer spending, which accounts for the majority of overall economic activity.
Next week is crucial as all eyes will be on the upcoming US Fed Interest rate decision. While the majority of markets expect a hike of 25 bps, it could potentially be the last hike to counter the ongoing inflation.
Crypto Markets Overview
- This week, crypto markets are down by 1.7% totaling to 1.19 trillion with BTC and ETH up by 2.6% and 3.8% respectively. Bitcoin dominance stands at 49.8% with Ethereum at 19.5%.
- BTC dominance reaches a 1 month low at 49.8% from a 52.16% high in late June, as investors are shifting their focus to smaller, riskier tokens commonly known as altcoins
- Bitcoin Fear and Greed Index sinks into neutral territory, a sign of investor uncertainty. A tumbling tech sector and rising dollar this week kept crypto investors in their recent, range bound trance with BTC stuck between $29,500 – $31,300
- XRP surpassed Bitcoin in trading volume this week after a court ruling determined that it is not a security. XRP now accounts for 21% of the market’s volume with BTC having 20% share in volumes.
- Polygon (MATIC) begins groundwork for decentralized governance to revamp the mechanism for the forthcoming Polygon 2.0 roadmap, with the aim of establishing several layer 2s on the network
- Polygon daily active users surpasses Ethereum, Solana as DeFi activity grows. As per DeFiLlama, in the last 24 hours, Polygon blockchain witnessed over 405k active users while Ethereum and Solana at the same time had around 332k and 122k users respectively.
- Chainlink (LINK) surged to a 3 months high with the launch of its cross-chain interoperability protocol (CCIP) on Avalanche, Ethereum, Optimism, and Polygon mainnets allowing users to easily move tokens from one chain to another.
- Stellar Lumens (XLM) partnered with Bitso, a popular latin america’s crypto exchange to expand its payment network, integrating Stellar’s Anchor network, enabling money transfers made easier and cheaper with this integration
- BNB Chain burns nearly $500Mn worth of BNB Tokens under the “auto-burn” mechanism in what is the token’s 24th quarterly burn event. The burned tokens are now permanently destroyed, which makes circulating tokens more valuable if demand increases.
- Troubled crypto lender Celsius moves $59.4 million in altcoins to potentially sell for BTC, ETH. This is the second time this month that Celsius appears to have prepared a large swathe of altcoins to be transferred into BTC and ETH.
Bitcoin Technical Analysis
Source: TradingView
Summary:
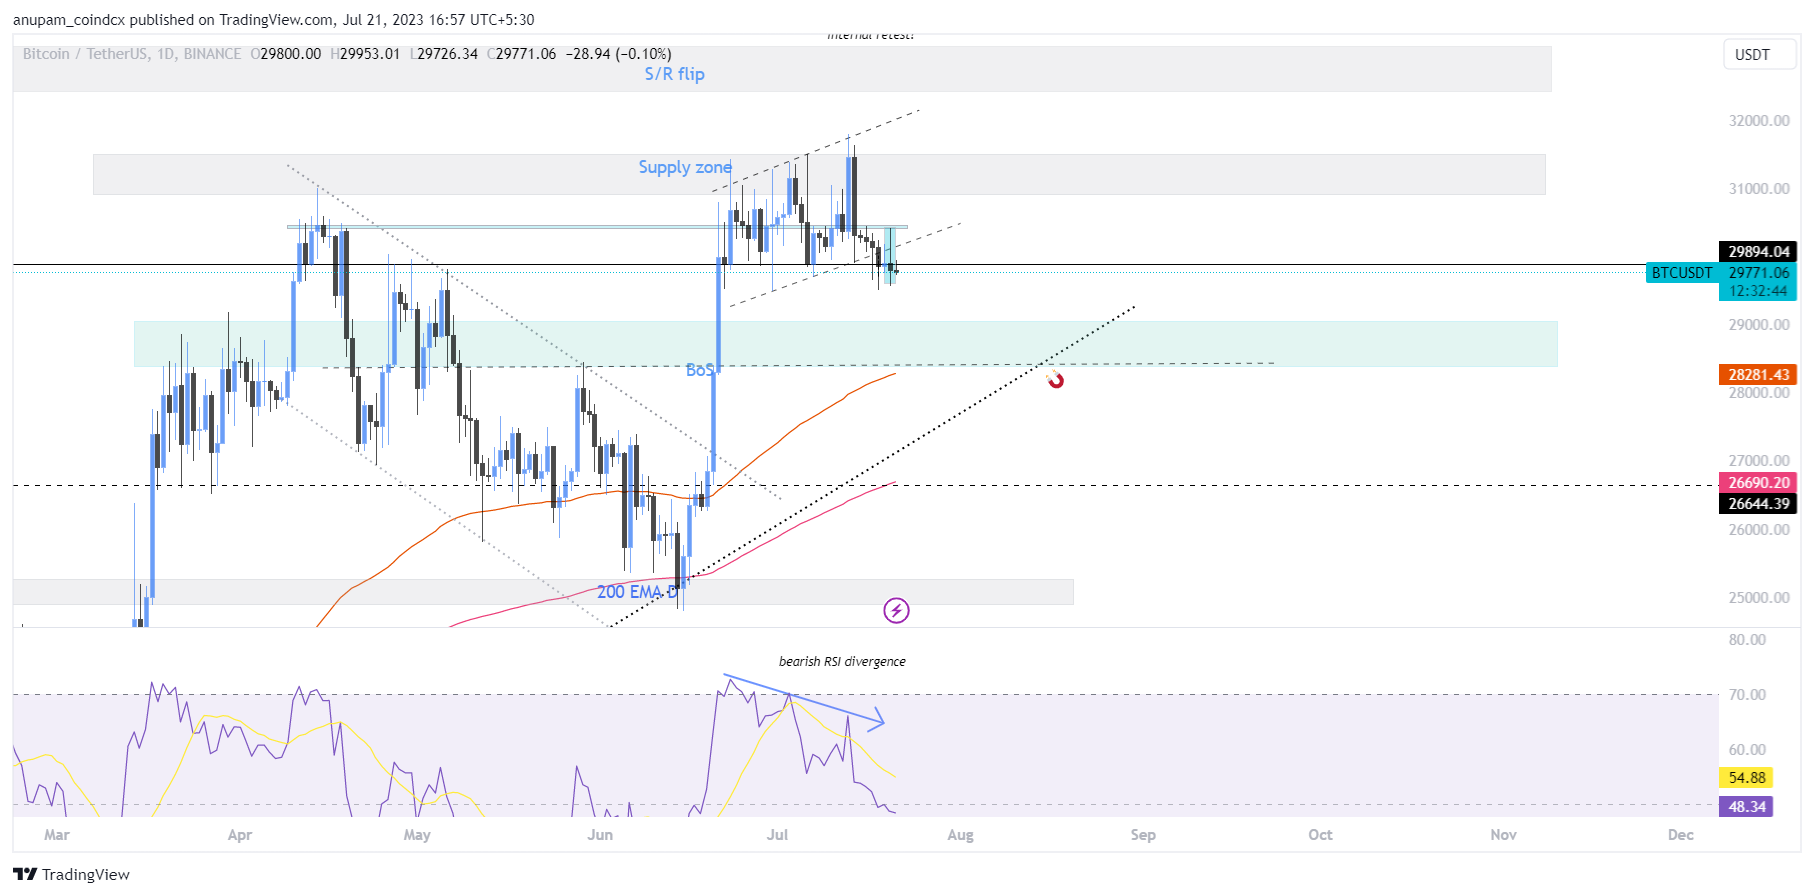
- In the 4-hour timeframe, BTC is currently finding support at the 200-period exponential moving average (EMA).
- In the 1-day timeframe, there is bearish RSI divergence, indicating a potential weakening of the bullish momentum.
- Important support levels to keep an eye on are at $29,400 and $28,400.
- Important resistance levels to keep an eye on are at $30,450 and $31,500.
Ethereum Technical Analysis
Source: TradingView
Summary:
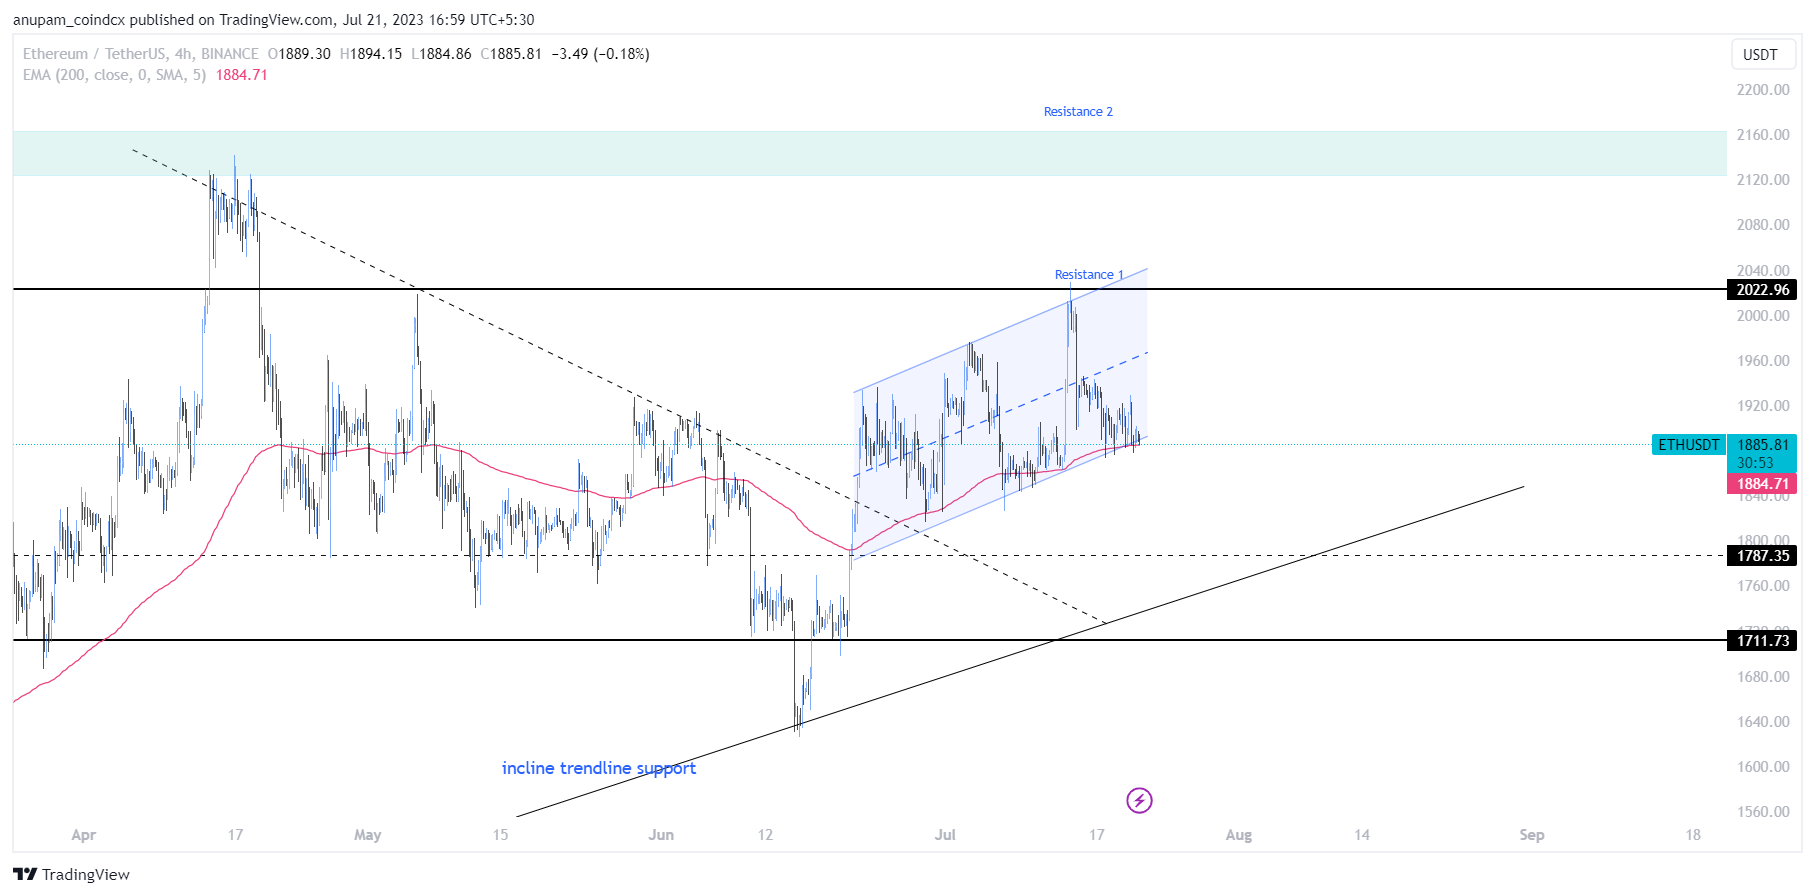
- Throughout this week, Ethereum (ETH) has experienced a period of fluctuation in which the price has been moving in a sideways direction, but with a consistent backing from the 200-period exponential moving average (EMA) on the 4-hour chart.
- Key indicators such as the Relative Strength Index (RSI) and Moving Average Convergence Divergence (MACD) are showing balanced readings, suggesting a lack of strong buying or selling pressure.
- Below the current price level, there are two important support levels at $1787 & $1711, which are significant in providing potential price support.
- ETH needs to overcome two important resistance levels at $2022 and $2164 respectively to continue bullishness.
Disclaimer: Crypto products and NFTs are unregulated and can be highly risky. There may be no regulatory recourse for any loss from such transactions. The Content is for informational and educational purposes only. The Content is not an offer, or solicitation of an offer, to invest in, or to buy or sell any interest or securities or virtual digital assets or to participate in any investment or trading strategy.The Content or any part of it is not legal, financial, investment or tax advice. The calculations, data, risk return formulations, performance or market capitalization indicators are based on the independent data sourced by CoinDCX or third parties. Past performance is not indicative of any future results.