This Tron crypto price prediction explores TRX price targets from today and this week through 2026, 2030, and 2040. Analyze key support and resistance levels, RSI, and moving averages to evaluate potential short- and long-term price trends. The forecast covers technical momentum, projected price ranges, and market scenarios to outline how TRX could perform across different timeframes.
Tron (TRX) is currently trading at $0.33004, reflecting bearish market sentiment as of October 12, 2026. The 14-day RSI sits at 36.94, now under its signal average at 45.10 by more than eight points and closing in on oversold territory. Concurrently, the 50-day and 200-day EMAs are positioned at approximately $0.33503 and $0.32786, respectively. TRX is trading 0.99% below the 100-day EMA at $0.33334, while the 20-day EMA at $0.33458 has crossed beneath the 50-day, leaving price below every major daily average except the 200-day line. Based on these technical indicators and broader market trends, TRX is expected to test support near $0.3279 to $0.3220 through the second half of October, with the 200-day EMA serving as the primary structural floor for this pullback.
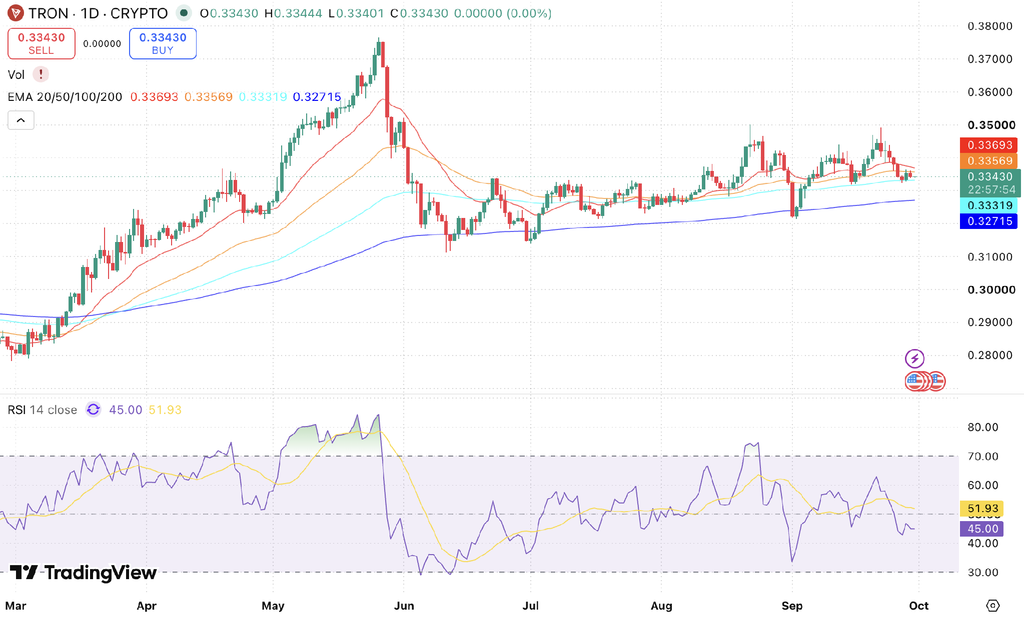
TRON/USD, Source TradingView
Key Insights
- This week: TRX price may hold between $0.3279 and $0.3350, with the 200-day average at $0.3279 serving as the pivotal line that decides direction.
- October 2026: TRX targets $0.3340 over the coming month, with $0.3220 support and $0.3450 resistance framing the broader trading range.
- 2026: TRX is projected between $0.3220 and $0.3560, with a December target of $0.3470 provided the 200-day EMA holds as structural support.
- 2030: Long-term price projections depend on broader market cycles, TRON network adoption, and stablecoin settlement volume rather than daily chart indicators alone.
- Technical analysis: The 20-day EMA has crossed below the 50-day for the first time this cycle, and TRX now sits just 0.66% above its 200-day EMA at $0.32786.
Read how to execute your first TRX purchase on CoinDCX
Tron Short-Term Price Prediction – Today, This Week, October 2026
Here is the Tron coin price prediction 2026 for today, this week, and October 2026.
| Timeframe | Price Target | Support | Resistance | ROI |
|---|---|---|---|---|
| Next 24 Hrs | $0.3290 | $0.3279 | $0.3320 | -0.32% |
| This Week | $0.3310 | $0.3279 | $0.3350 | +0.29% |
| Oct 2026 | $0.3340 | $0.3220 | $0.3450 | +1.20% |
Tron Price Prediction Today
The 24-hour target for TRX is $0.3290, with support at $0.3279 and resistance at $0.3320. Tron is trading at $0.33004, extending a run of lower daily closes that has taken roughly 1.7% off the price in under a week. The latest session ranged between $0.32978 and $0.33145, with the intraday low slipping under the $0.3300 mark. That band is less than half the width of the breakdown session below the 100-day EMA, pointing to steady selling rather than capitulation. A close back above $0.3320 opens the 100-day EMA at $0.33334, while a close below $0.3279 exposes $0.3220.
Tron Coin Price Prediction for This Week
This week’s price target for Tron is $0.3310, inside a $0.3279 to $0.3350 range for October 12 to 18, 2026. Price is now 1.49% below the 50-day EMA at $0.33503, and the 20-day EMA at $0.33458 has crossed below that line, sitting $0.00045 beneath it. That crossover is the first bearish moving average signal of this cycle, although with RSI near 37 the decline is already stretched. A weekly close above $0.3350 puts $0.3400 back in play, while a drop under $0.3279 opens the way to $0.3220.
Tron Coin Price Prediction for October 2026
Tron’s October 2026 price is expected to reach $0.3340, with support at $0.3220 and resistance at $0.3450. TRX trades just 0.66% above its 200-day EMA at $0.32786, a cushion that has shrunk from 2.48% at the start of last week. Every test of that average since June has ended in a recovery, including the early-September flush, and the monthly target assumes a similar rebound back to the 100-day EMA. A daily close beneath the 200-day would undercut that assumption and put the $0.3220 September low in play.
Tron Price Prediction for November 2026
Tron’s price is projected to reach $0.3400 in November 2026, inside a $0.3260 to $0.3490 range. That target assumes the 200-day EMA holds through October and price reclaims the 100-day line before the month opens. The 200-day EMA has ascended without interruption since July, supporting a November target above spot, although its slope has flattened in October. A monthly close above $0.3490 would bring the late-September barrier at $0.3500 back into view.
Tron Price Prediction 2026 (Medium Term)
| Month | Price Target | Support | Resistance | ROI |
|---|---|---|---|---|
| Oct 2026 | $0.3340 | $0.3220 | $0.3450 | +1.20% |
| Nov 2026 | $0.3400 | $0.3260 | $0.3490 | +3.02% |
| Dec 2026 | $0.3470 | $0.3330 | $0.3560 | +5.14% |
Tron’s 2026 price range is projected at $0.3220 to $0.3560, based strictly on the prevailing price structure and technical levels. The 200-day EMA at approximately $0.32786 remains the key macro trend divider, and price sits only 0.66% clear of it after a week of steady selling. The 20-day EMA has crossed below the 50-day, confirming that the short-term trend has turned lower. How price behaves at the 200-day will determine if the $0.3450 to $0.3560 band is reached before the year closes.
Tron Price Prediction in INR for Indian Traders
Converted at the live USD/INR rate of approximately ₹96.0, the key TRX levels for this cycle are as follows.
| Level | USD | INR |
|---|---|---|
| Current price | $0.33004 | ₹31.68 |
| Support | $0.3279 | ₹31.48 |
| Resistance | $0.3320 | ₹31.87 |
| Oct 2026 target | $0.3340 | ₹32.06 |
| Dec 2026 target | $0.3470 | ₹33.31 |
| 2030 target | $0.510 | ₹48.96 |
INR values move with the exchange rate as well as the TRX price, so both should be checked against live figures.
Tron Price Prediction 2026 to 2040 (Long Term)
| Year | Price Target | Support | Resistance | ROI |
|---|---|---|---|---|
| 2027 | $0.385 | $0.360 | $0.410 | +16.65% |
| 2028 | $0.415 | $0.385 | $0.445 | +25.74% |
| 2029 | $0.455 | $0.415 | $0.495 | +37.86% |
| 2030 | $0.510 | $0.460 | $0.560 | +54.53% |
| 2031 | $0.550 | $0.490 | $0.610 | +66.65% |
| 2035 | $0.700 | $0.600 | $0.800 | +112.10% |
| 2040 | $1.000 | $0.800 | $1.200 | +202.99% |
Tron 2030 Forecast: What Is the Expected Price?
Tron price prediction 2030 targets $0.510, within a range of $0.460 to $0.560, based on a multi-year extrapolation of the primary uptrend. Reaching that level requires network activity and market cycle liquidity to expand through at least one more full cycle, which carries greater significance over a four-year horizon than daily chart indicators.
Tron 2031 Outlook and Expected Price Range
Tron’s price is projected to reach $0.550 in 2031, within a range of $0.490-$0.610. That assumes the long-term upward trajectory visible in the Tron price history continues. A projection this far out rests on network usage and cycle timing more than daily structure, so the range describes a path and not a schedule.
Tron price prediction 2040: Long-Term Forecast
By 2040, the Tron price forecast is projected at $1, ranging from $0.800 to $1.200, extending the multi-year macro structure across fourteen years. The decisive factor is the volume of global settlement and remittance transfers the TRON network handles. These figures are best interpreted as scenario ranges rather than definitive targets.
Tron Technical Analysis
The following technical indicators were used to derive the price predictions above.
| Indicator | Value | Signal |
|---|---|---|
| Relative Strength Index (14-Day RSI) | 36.94 | Bearish |
| 50-Day EMA | $0.33503 | Bearish |
| 200-Day EMA | $0.32786 | Bullish |
Relative Strength Index (RSI)
The 14-day RSI is at 36.94, beneath both the 50 midline and its signal average at 45.10. Momentum is firmly on the bearish side of both markers, and the gap to the signal line has widened to more than eight points. At 36.94, the indicator sits close to the low-30s reading that marked the early-September bottom, showing that downside momentum is stretched even though it has not yet turned up. A reversal from here would be the first sign of recovery, with 45.10 marking the level needed to repair the indicator’s signal line.
Exponential Moving Averages (50-Day & 200-Day EMA)
TRX is trading beneath its 20-day EMA at $0.33458, its 50-day EMA at $0.33503 and its 100-day EMA at $0.33334 by 1.36%, 1.49% and 0.99%, respectively, while holding 0.66% above the 200-day EMA at $0.32786. Price has extended its drop below the corridor between the 100-day and 50-day EMAs that contained it through late September and early October. The 20-day EMA has crossed $0.00045 below the 50-day, the first negative moving average signal since the summer. With the 100-day EMA lost, the 200-day EMA at $0.32786 is the primary structural floor, and it now sits within a quarter of a cent of price.
Disclaimer: This article is for informational purposes only and does not constitute financial or investment advice. Crypto markets are highly volatile. Always do your own research (DYOR) before making any investment decisions.
FAQs
Q1. What will Tron be worth in 2026?
Tron is projected to trade between $0.3220 and $0.3560 through 2026, with a year-end target of $0.3470. Reaching this target requires TRX to hold its 200-day EMA at $0.32786 on daily closes.
Q2. What will be the price of 1 TRX in 2030?
1 TRX is projected to reach about $0.510 in 2030, within an expected range of $0.460 to $0.560. This estimate assumes continuous growth in TRON's network adoption and stablecoin settlement volume.
Q3. Will the Tron price ever hit $10?
No, Tron price reaching $10 is extremely unlikely. Reaching $10 would push Tron's market cap to roughly $950 billion, which is 30 times its current size. Long-term models project a much more realistic target of $1.000 by 2040.
Q4. Is Tron a safe investment?
TRX is one of the more stable large-cap cryptocurrencies, with fundamentals that set it apart from most altcoins. Its strength comes from consistently high daily network activity and one of the largest USDT volumes of any blockchain, which gives the token real utility and deep liquidity. As with any digital asset, its price can still dip during market-wide sell-offs, so TRX suits investors who understand the network and invest in line with their risk appetite.