


This technical analysis evaluates short-term, medium-term, and multi-year SOL trends across daily, weekly, 2026, 2030, and 2040 horizons. Using quantitative indicators, including the Relative Strength Index (RSI), Exponential Moving Averages (EMAs), and volume profiles, this forecast outlines operational support levels, overhead resistance barriers, and long-term expansion targets based on prevailing market structure.
Solana (SOL) trades near $94.78 after a sharp sell-off broke the $100 floor and pushed the price below the 200-day EMA for the first time since the August breakout. SOL opened at $95.29 and is down 0.56% within an intraday channel of $94.18 to $95.80, with the daily session roughly 65% complete.
The 14-day RSI has slipped to 29.65, entering oversold territory below 30, and trails its signal moving average at 36.77. Meanwhile, the 20-day, 50-day, 100-day, and 200-day EMAs are positioned at $101.95, $104.07, $99.98, and $98.17, respectively, with all four lines now sloping lower. The breakdown has turned the former $98.00 to $100.00 support zone into overhead resistance. However, the recent plunge to about $92.14 was bought back by nearly $4 within the same session, and the 100-day EMA still leads the 200-day line by $1.81.
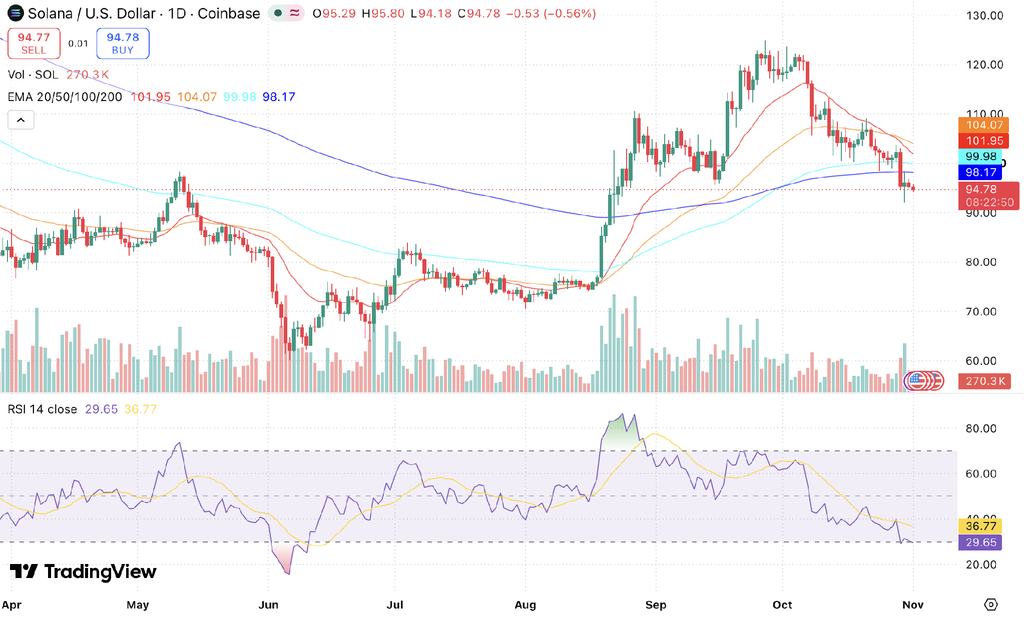
SOL/USD daily chart, Source: TradingView
Key Insights
- Short-term outlook: SOL lost nearly 7% in a single session late last week, closing below the 100-day EMA, the $100 floor, and the 200-day EMA simultaneously after four earlier intraday breaks below $100 were absorbed. The subsequent session extended the slide to about $92.14 (its lowest level since late August) before buyers lifted the price nearly $4 to close near $96.08; SOL has since drifted between $94 and $97. Reclaiming the 200-day EMA at $98.17 is now the immediate objective, while the recent low near $92.14 and the $90 psychological level represent critical support floors.
- Medium to long-term outlook: The 50-day EMA at $104.07 leads the 200-day EMA at $98.17 by $5.90, narrowing from $7.10 as the 50-day line declines. Meanwhile, the 100-day EMA at $99.98 leads the 200-day line by $1.81, down from $2.07, and both longer averages have begun rolling over. The 20-day EMA has widened its deficit below the 50-day line to $2.12 from $0.56, while the price sits 3.5% below the 200-day line, erasing the cushion maintained since August.
- Technical analysis: The 14-day RSI has dropped to 29.65 and trails its signal average at 36.77 by 7.12 points after breaking below 30 during the sell-off, marking its first oversold readings since June. Turnover spiked on the breakdown session to $92.14, posting the heaviest volume since late September, while today’s 270.3K SOL volume shows that immediate selling pressure has moderated.
Trade SOL in INR on 
Deposit and withdraw in INR (₹).
No Conversion to Crypto Required.

Solana Short-Term Price Prediction – Today, This Week, November 2026
Here is the SOL price prediction for today, this week, and November 2026.
| Timeframe | Price Target | Support | Resistance | ROI |
|---|---|---|---|---|
| Next 24 Hrs | $95.50 | $94.18 | $96.80 | +0.76% |
| This Week | $96.50 | $92.14 | $98.17 | +1.81% |
| November 2026 | $98.00 | $90.00 | $104.07 | +3.40% |
Solana Price Prediction Today
The Solana price prediction for today is $95.50, with the price expected to trade between $94.18 and $96.80. Solana is trading at $94.78, down 0.56%, sitting $3.39 below the 200-day EMA after last week’s breakdown. Today’s low of $94.18 represents immediate support, backed by the recent low near $92.14 and the $90 psychological level. The recent session high near $96.80 provides immediate overhead resistance, followed by the 200-day EMA at $98.17 and the 100-day EMA at $99.98.
Solana Coin Price Prediction for This Week
The Solana price forecast for this week is $96.50, within an expected range of $92.14 to $98.17. This projection assumes the recent low near $92.14 holds and the oversold RSI supports a relief bounce back toward former support. A daily close back above the 200-day EMA at $98.17 would open a retest of the $100 mark and the 100-day EMA at $99.98, whereas a daily close below $92.14 would expose the late-August lows near $91.50 and the $90 psychological baseline
Solana Price Prediction for November 2026
The Solana price target for November 2026 is $98.00, with an expected trading range of $90.00 to $104.07. The moving-average structure has turned bearish across all timeframes, with the price below all four EMAs, the 20-day line $2.12 beneath the 50-day line, and both the 100-day and 200-day lines rolling over. The baseline target assumes oversold conditions generate a relief bounce back toward the 200-day EMA during the month, while a recovery above the 50-day EMA at $104.07 is required to confirm that the breakdown has failed. A sustained close below $90 would expose deeper structural correction levels.
Read more: How to buy Solana in India
Solana Coin Price Prediction for December 2026
Solana is predicted to reach $106.00 in December 2026, within an expected range of $92.00 to $119.90. The December target assumes SOL first reclaims the 200-day EMA and the $100 level during November, then works back toward the 50-day EMA (currently at $104.07) as oversold conditions fully unwind. The broken $98.00-to-$100.00 zone is now the critical supply barrier; a confirmed daily close above it is the initial requirement for trend repair, while failure to recover it would keep December trading constrained to the lower half of the band.
Solana Price Prediction 2026-2027 (Medium Term)
| Month | Price Target | Support | Resistance | ROI |
|---|---|---|---|---|
| Nov 2026 | $98.00 | $90.00 | $104.07 | +3.40% |
| Dec 2026 | $106.00 | $92.00 | $119.90 | +11.84% |
| Jan 2027 | $114.00 | $96.00 | $128.00 | +20.28% |
| Feb 2027 | $120.00 | $100.00 | $135.00 | +26.61% |
| Mar 2027 | $125.00 | $104.00 | $140.00 | +31.88% |
Solana’s 2026 price range is projected at $90.00 to $119.90 based on the prevailing EMA structure. Into early 2027, the monthly targets step up from $114.00 in January to $125.00 in March, a path that assumes SOL reclaims the 200-day EMA and repairs the bearish 20-day and 50-day EMA crossover before the end of 2026. Last week’s sell-off ended the run of intraday breaks below $100 that buyers had absorbed, with SOL closing below the 200-day EMA for the first time since the August breakout and sliding as low as about $92.14 before a partial rebound.
Spot price now trades below all four EMAs; the 50-day line leads the 200-day line by $5.90, and the 100-day line leads the 200-day line by $1.81. The breakdown has taken price 3.5% below the 200-day EMA, compared with roughly 28.8% above it in late September. Momentum is oversold, with the RSI below 30, which raises the odds of a relief bounce, but the broader uptrend that began in August is invalidated until price reclaims the 200-day EMA on a sustained daily-close basis.
Want to diversify beyond Solana? Check out the Top 10 Cryptos To Invest In November 2026
Solana Price Prediction in INR (2026-2030)
SOL currently trades near ₹9,042. Here is what the price targets translate to in rupees.
| Period | SOL Target USD | SOL Price INR est. |
|---|---|---|
| November 2026 | $98.00 | ₹9,349 |
| December 2026 | $106.00 | ₹10,112 |
| 2027 | $138.00 | ₹13,165 |
| 2030 | $170.00 | ₹16,218 |
INR estimates based on a USD/INR rate of ~₹95.4. Rate fluctuations will affect actual INR values.
Solana Long-Term Price Outlook (2027-2040)
Solana is projected to trade between $138.00 in 2027 and $300.00 by 2040. The multi-year outlook rests on three structural pillars: high throughput and low fees driving adoption, liquidity expansion from the 2028 Bitcoin halving cycle, and growing institutional interest through regulated investment vehicles.
The following forecasts are derived from Power Law and network-adoption models, broader Bitcoin halving-cycle analysis, and historical SOL volatility patterns. They represent scenario ranges, not price targets.
| Year | Price Target | Support | Resistance | ROI |
|---|---|---|---|---|
| 2027 | $138.00 | $96.00 | $150.00 | +45.60% |
| 2028 | $144.00 | $130.00 | $155.00 | +51.93% |
| 2029 | $150.00 | $135.00 | $155.00 | +58.26% |
| 2030 | $170.00 | $155.00 | $180.00 | +79.36% |
| 2031 | $185.00 | $168.00 | $195.00 | +95.19% |
| 2035 | $240.00 | $215.00 | $255.00 | +153.22% |
| 2040 | $300.00 | $270.00 | $320.00 | +216.52% |
Where Will Solana Price Go in 2030?
The Solana price prediction for 2030 is $170.00, within an expected range of $155.00 to $180.00. This projection is supported by structural liquidity from the 2028 halving cycle and the preserved long-term moving-average structure. Network adoption models indicate that expanding institutional settlement and high-frequency financial applications could push spot prices toward the upper boundary.
Where Will Solana Price Go in 2031?
The Solana price target for 2031 is $185.00, with an expected range of $168.00 to $195.00. The digital asset market enters the post-2028 halving digestion phase during this period. Historical cycles suggest that 2031 will serve as a consolidation and base-building phase following cycle peaks, with validator participation and total value locked (TVL) serving as primary health metrics.
Where Will Solana Price Go in 2040?
The Solana price forecast for 2040 is $300.00, with an expected range of $270.00 to $320.00. Solana’s price at the upper bound would sit just above the all-time high of $293.31 set in January 2025, so the scenario assumes the asset reclaims and holds beyond its previous peak. Metcalfe’s Law and Power Law models support this range under moderate adoption, while aggressive scenarios exceed $320. These forecasts carry high uncertainty and should be read as scenario ranges, not fixed targets.
Solana Technical Analysis
The following technical indicators were used to derive the Solana price prediction above.
| Indicator | Value | Signal |
|---|---|---|
| Relative Strength Index (14-Day RSI) | 29.65 | Oversold, first sub-30 since June |
| RSI Moving Average | 36.77 | 7.12 points above RSI, falling |
| 20-Day EMA | $101.95 | Falling, resistance $7.17 above spot |
| 50-Day EMA | $104.07 | Falling, resistance $9.29 above spot |
| 100-Day EMA | $99.98 | Turning lower, resistance $5.20 above spot |
| 200-Day EMA | $98.17 | Price 3.5% below, first close below since August |
| Trading Volume | ~270.3K SOL so far | Session about 65% done |
Relative Strength Index (RSI)
The 14-day RSI has slipped to 29.65 and sits 7.12 points below its signal moving average at 36.77, after breaking below 30 during last week’s sell-off. These represent the indicator’s first oversold readings since June, having fallen from roughly 45 to below 30 in less than two weeks.
The signal line is falling as well, indicating that momentum remains negative, although stretched readings frequently precede short-term relief rallies. Because the RSI remains well beneath the 50 neutral midline, broader corrective pressure stays active until the indicator decisively reclaims 50, while a sustained recovery above 40 would be the initial sign of selling exhaustion.
Exponential Moving Averages – 20-Day, 50-Day, 100-Day and 200-Day EMA
SOL trades below the 20-day EMA at $101.95, the 50-day EMA at $104.07, the 100-day EMA at $99.98, and the 200-day EMA at $98.17. All four averages are sloping lower, with the 100-day and 200-day lines rolling over for the first time since the August breakout. The golden cross spread has compressed to $5.90 from $7.10, while the 100-day EMA leads the 200-day line by $1.81, so the macro moving average configuration remains technically intact despite price trading underneath.
The 20-day EMA now sits $2.12 below the 50-day EMA, widening from $0.56 as the bearish crossover deepens. The spot price sits 3.5% below the 200-day line, $5.20 below the 100-day line, $9.29 below the 50-day line, and $7.17 below the 20-day line. The $98.17-to-$99.98 zone formed by the 200-day and 100-day EMAs, which previously provided structural support, has now flipped into the primary overhead resistance barrier. A daily close back above that band would signal a failed breakdown, while continued closes beneath it keep the trend tilted downward.
Volume Analysis
Turnover surged during the breakdown, with the session that tested $92.14 printing the heaviest volume since late September, exceeding the 1.01M SOL recorded during the earlier break below the 20-day line. That volume spike, paired with a daily close nearly $4 above the lows, points to capitulation-style liquidations met by absorption buying.
Today’s session has logged a lighter 270.3K SOL at roughly 65% completion, indicating consolidation and reduced seller velocity following the flush. A confirmed daily close above $98.17 on expanding green volume is required to confirm that buyers have reclaimed directional control.
What Does the Solana Price Prediction Mean for Indian Traders?
Firedancer independent validator client progress and Alpenglow consensus updates remain Solana’s primary network development catalysts, with expanding on-chain throughput historically providing fundamental support for secondary market pricing. In rupee terms, SOL trades near ₹9,042 on CoinDCX, rebounding from approximately ₹7,000 recorded in early August. Compared to the 2030 base-case projection of ₹16,218, this models a potential 1.8x expansion over four years.
Disclaimer: This article is for informational purposes only and does not constitute financial or investment advice. Digital asset markets are highly volatile and prices can change rapidly. Past performance is not indicative of future results.
FAQs
Q1. Will the Solana price ever hit $1000?
Solana reaching $1,000 remains unlikely over the projected forecast horizon, as it would require a gain exceeding ten times from current levels and place the asset far above the $270 to $320 channel projected for 2040, demanding unprecedented institutional capital concentration and fee capture.
Q2. What will Solana be worth in 2027?
SOL is projected to trade between $96.00 and $150.00 across 2027 with a base-case target of $138.00 (approximately ₹13,165), assuming the long-term higher-low structure holds and network throughput continues to expand.
Q3. What will be the price of 1 SOL in 2030?
1 SOL is forecast to trade between $155.00 and $180.00 in 2030, with a baseline average target of $170.00 (roughly ₹16,218 at projected benchmarks), supported by post-2028 halving liquidity and institutional adoption.
Q4. Is Solana a safe investment?
Solana is safer than most cryptos but riskier than any conventional investment, and it should be sized accordingly. However, it benefits from high network liquidity, an active developer community, and expanding institutional adoption. Investors should track key technical levels like the 200-day EMA at $98.17 to manage downside risk.
Q5. What was Solana’s highest price?
Solana’s highest price to date is $293.31, recorded on January 19, 2025. SOL currently trades near $94.78, leaving it about 68% below that peak. Long-term scenario modeling through 2040 anticipates the price testing and reclaiming that historical high rather than expanding significantly beyond it.