


This report provides insights and analysis for the Futures market, exclusively designed for you with the focus on understanding short-selling strategies.
Ticker: GRT
Category: AI & Big Data
Market Cap: $1,162,424,553
Circulating Supply: 8,943,307,564
Total Supply: 10,644,069,397
Price Update: The Graph is an indexing protocol for querying data for blockchain networks, powering many applications in both DeFi and the broader Web3 ecosystem. Its price at the time of writing (2nd May, 16:30) is $0.13 with 24-hour trading volume of $23,648,747. GRT price is down by 3.18% in the last 24 hours.
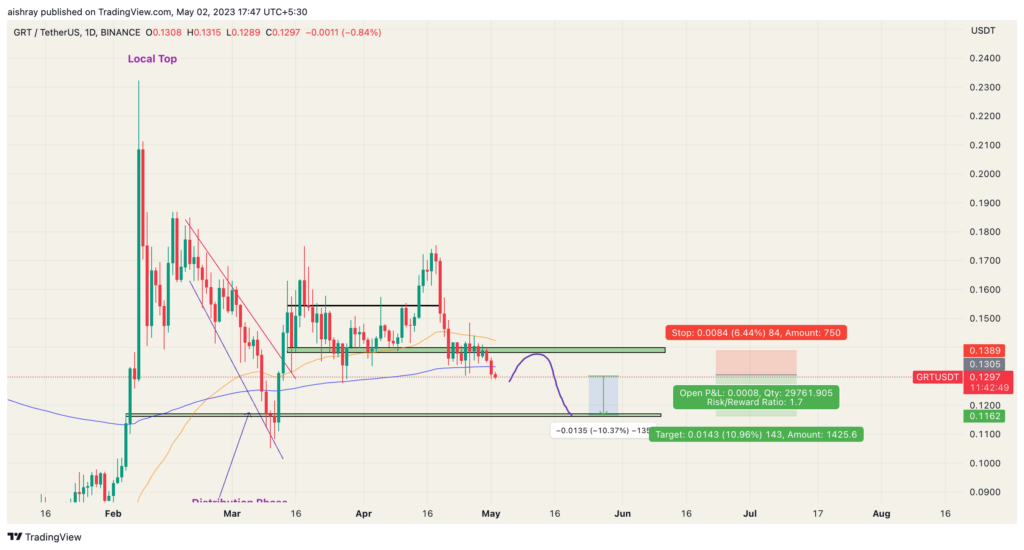
Source: Tradingview
With Reference to above Chart:
- GRT experienced a local top in the month of Feb ’23, when the wave of AI smashed the market and all tokens related to it skyrocketed.
- However, as the market has now entered a slow period of consolidation, which is on the bearish note, we can expect GRT to fall further.
- The current prices are $0.13 with 200 Daily EMA at $0.134 which could act as a strong resistance, followed by resistance at $0.14
- For Swing Short Trading strategy, a short position can be assessed between $0.13-$0.136, with invalidation above $0.14.
- On the downside, one can see 8-10% fall towards $0.116 with 1st level of consolidation at $0.12 before moving further down.
- In order to cope with the ongoing slow bearish trend, it is advisable to maintain a good risk to reward ratio and limit the use of leverage and position size. A longer time horizon may be necessary to ride out the current market conditions.
- Note: GRT is now available in the futures market in both Go and Pro apps with up to 15x leverage.
Trade GRT Futures in CoinDCX Pro
Disclaimer:
Crypto products and NFTs are unregulated and can be highly risky. There may be no regulatory recourse for any loss from such transactions. The Content is for informational and educational purposes only. The Content is not an offer, or solicitation of an offer, to invest in, or to buy or sell any interest or securities or virtual digital assets or to participate in any investment or trading strategy.The Content or any part of it is not legal, financial, investment or tax advice. The calculations, data, risk return formulations, performance or market capitalization indicators are based on the independent data sourced by CoinDCX or third parties. Past performance is not indicative of any future results.
