
Macro Overview
This week, we saw a massive sell off in the market, with BTC falling below $28,000 and ETH losing its $2000 mark. The significant drop in the value happened mainly after the release of UK consumer price data on Wednesday, which revealed that inflation remained above 10% in March.
This added to concerns that central banks would need to continue increasing interest rates, which caused traders to pause. Prior to this, Bitcoin had increased by about 80% this year, mainly driven by speculation that interest rate cuts were likely to occur.
Recent economic indicators from the US suggest that the Federal Reserve is unlikely to stop increasing interest rates due to concerns about regional bank crises. While a measure of US inflation showed some signs of improvement in March, it may not be enough to prevent the Fed from changing course.
However, the Indian Stock Market, the US Markets are positioned in bullish note and after the mild correction, Bitcoin will be following a similar trend.
Crypto Market Overview
Bitcoin price loses directional bias
This week, we saw a massive sell off in the market, triggering liquidations of $175 million worth of long positions across crypto markets. Last week saw a significant surge in Ethereum’s value, with the ETH surpassing the $2000 mark and BTC crossing $30,000 for the first time in nine months. This bullish movement was followed by many other ALT tokens also making impressive gains. Many tokens like AVAX, GRT, and NEAR also saw gains of over 10%.
Bitcoin: Technical Analysis
In our previous State of The Market Report dated 24th March we mentioned “The more BTC resists a sharp pullback from $28.6K, the higher the chances of it breaking on the upside and price targeting $34K.”
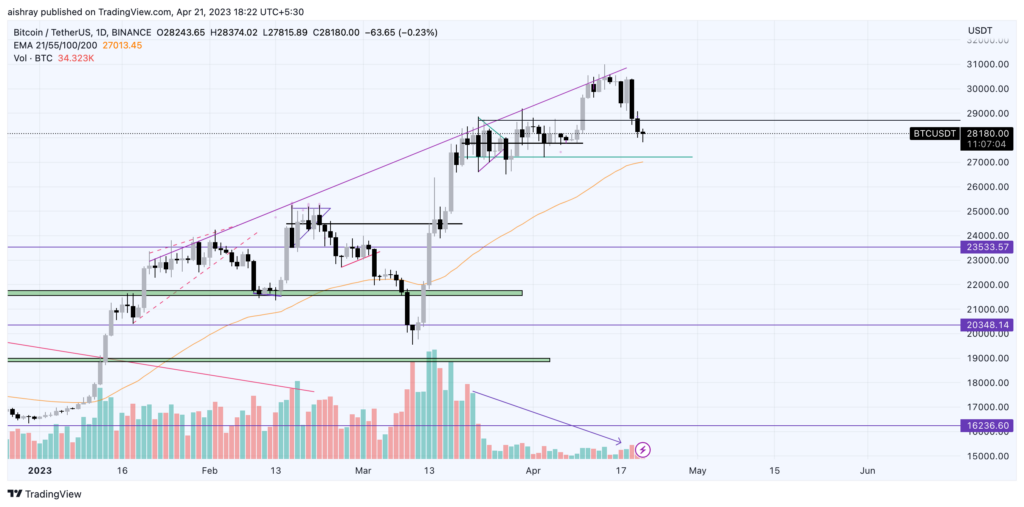
Bitcoin recently experienced a surge in value, hitting an impressive $31,000. However, this was followed by a period of consolidation and a massive selloff in the market. As a result, BTC is currently trading at $28,190.
With the directional bias of the bulls now changing momentarily, it may not be profitable to enter a long position. Instead, a small relief could potentially lead to further dump in the market. As traders look to navigate this market, it’s important to note that the next support zone for BTC is forming at $27200.
This support zone is significant as it coincides with a previous zone and the 55 EMA. This convergence of technical indicators suggests that $27200 could be a key level of support for BTC going forward. As always, it’s important to keep a close eye on market movements and to make informed decisions based on the available data.
Source: Tradingview
Ethereum: Technical Analysis
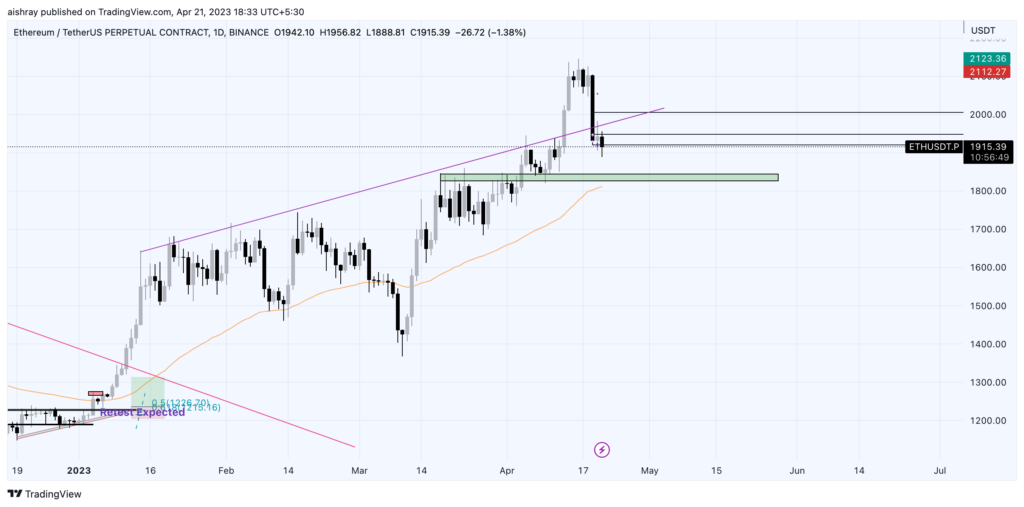
In our token analysis report dated April 4th, we were able to catch the momentum of ETH from $1860 to $1980. However, after marking a local top at $2140, ETH experienced a massive selloff and is currently trading at $1910. As traders look to navigate this market, it’s important to note that the next support zone for ETH is forming at $1860-$1840. Before making any directional positions, it would be wise to observe the reaction of the market at this level.
Source: Tradingview
As always, market movements can be unpredictable, and it’s essential to remain vigilant and make informed decisions based on available data. Despite the recent volatility, the continued growth of Ethereum and other ALT tokens suggests that the cryptocurrency market is still ripe with opportunities for traders who are able to stay on top of market movements.
Disclaimer:Crypto products and NFTs are unregulated and can be highly risky. There may be no regulatory recourse for any loss from such transactions. The Content is for informational and educational purposes only. The Content is not an offer, or solicitation of an offer, to invest in, or to buy or sell any interest or securities or virtual digital assets or to participate in any investment or trading strategy.The Content or any part of it is not legal, financial, investment or tax advice. The calculations, data, risk return formulations, performance or market capitalization indicators are based on the independent data sourced by CoinDCX or third parties. Past performance is not indicative of any future results.