Macro Overview
Global crypto markets have declined by 1% over the last 7 days, currently standing at $1.1 trillion. The latest Federal Open Market Committee (FOMC) meeting showed divided opinions. While some members advocate for more interest rate hikes due to slow progress in reducing inflation, others see an economic slowdown and question the need for further tightening. Markets expect the May rate hike to be the last of this cycle, but FOMC officials are skeptical.
The uncertain macroeconomic climate has played a significant role in the overall decline of the crypto market, fueled by concerns surrounding inflation, crypto regulations, and the ongoing debt ceiling stalemate. Traders will be focusing on the forthcoming U.S. Core PCE inflation data, set to be released today will indicate a direction for a potential rate hike next month.
Crypto Market Overview
Bitcoin price slips down from $26,000 grounds
This week, we saw BTC dipping lower than $26,000 and many major crypto markets developments. In terms of digital asset investment products, there has been a consistent outflow totaling $232 million over five consecutive weeks. However, amidst this trend, Avalanche (AVAX), Litecoin (LTC), and Ripple (XRP) products witnessed inflows of $0.7 million, $0.3 million, and $0.2 million, respectively. Interestingly, the Bitcoin network has now emerged as the second-largest platform for Non-Fungible Token (NFT) transactions, showcasing its growing presence in this market. Over the past month alone, Bitcoin has accounted for approximately $167.47 million worth of NFT sales, significantly surpassing competitors like Solana and Muthos Chain, which recorded sales of $55.8 million and $35.4 million, respectively, during the same period.
Bitcoin Technical Analysis
Source: Tradingview
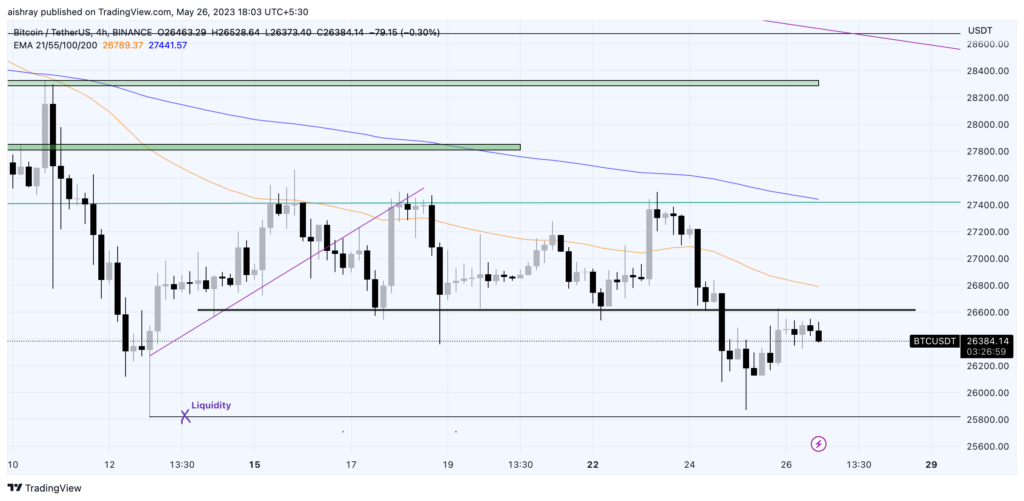
This week, Bitcoin (BTC) has been trading within a range of $26,600 to $27,400. It hasn’t been able to move beyond these boundaries. However, yesterday the support level of $26,600 was broken, indicating a downward shift in price. When the break occurred, the price action couldn’t surpass the previous liquidity point of $25,800. Currently, the price is undergoing a retest of the broken support.
During this 24-hour retest period, we also examined the aggregated cumulative volume delta and observed a continuous decrease in demand in the spot markets. Considering the analysis of the situation, it appears that the next potential support zone for the price action is around $25,000. This level was the peak reached back in February 2023, and it is likely to be the next target for the price movement.
Ethereum Technical Analysis
Source: Tradingview
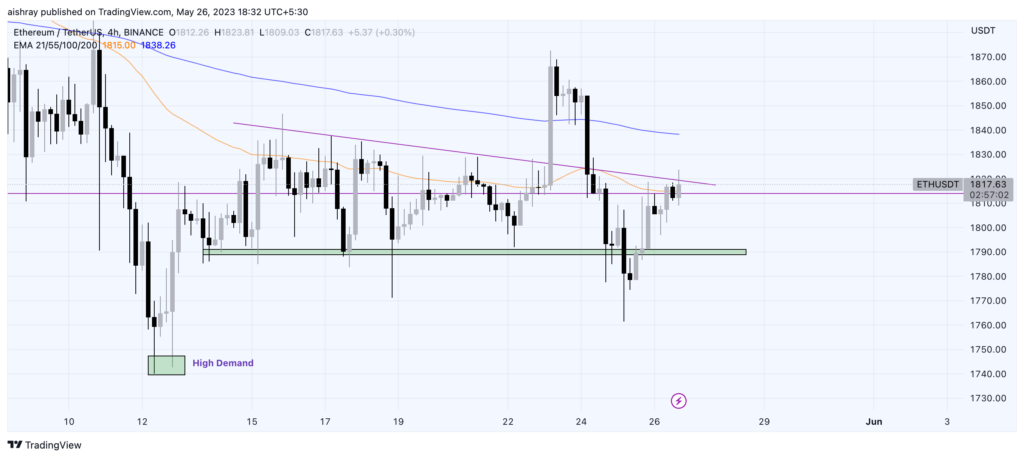
ETH is displaying more resilience and strength in the market compared to BTC. When comparing the charts of BTC and ETH, BTC has broken its support level and is currently retesting it. On the other hand, ETH has already surpassed the retest and is swiftly moving in an upward direction.
The reaction of this situation is crucial to observe. If ETH continues to exhibit strength, we can expect to see all-time lows (ATLs) rallying by 5-8%, ETH potentially rising by 3-4%, and BTC remaining relatively sideways. This would likely result in a decrease in BTC dominance.
There is a notable demand zone forming in ETH around the $1730-1750 range. If this support area holds, it would require significant volatility to break below it. Otherwise, there are higher chances of ETH moving upwards towards the $1980-2000 range.
Disclaimer:
Crypto products and NFTs are unregulated and can be highly risky. There may be no regulatory recourse for any loss from such transactions. The Content is for informational and educational purposes only. The Content is not an offer, or solicitation of an offer, to invest in, or to buy or sell any interest or securities or virtual digital assets or to participate in any investment or trading strategy.The Content or any part of it is not legal, financial, investment or tax advice. The calculations, data, risk return formulations, performance or market capitalization indicators are based on the independent data sourced by CoinDCX or third parties. Past performance is not indicative of any future results.