

Learn how to save chart layouts, indicator templates, and drawing templates on CoinDCX so your trading setup stays synced across devices.
What’s New in CoinDCX Charts?
CoinDCX charts now come with three new ways to save and reuse your trading setup:
- Chart Layouts: Save your full chart workspace, including symbol, timeframe, chart type, indicators, drawings, and visual settings.
- Indicator Templates: Save your favourite indicator combinations and apply them to any chart.
- Drawing Templates: Save the style of drawing tools such as trendlines, Fibonacci retracements, horizontal lines, and rectangles.
- AutoSave: Keep your active layout updated in the background as you work.
Together, these features help traders save once and access their setup across Web and Mobile.
Chart Layouts
A Chart Layout is a saved snapshot of your complete chart workspace. It helps you restore your preferred setup without manually rebuilding the chart every time you refresh, log in, switch devices, or return to the platform.
For example, if you analyse BTC-USDT on a 4-hour candlestick chart with Bollinger Bands, Volume, trendlines, and specific visual settings, you can save the entire setup as one layout. The next time you open charts, you can load the same workspace again.

What Can You Save in a Chart Layout?
A saved Chart Layout can include:
- Multi-chart arrangement, where applicable
- Trading pair or symbol, such as BTC-USDT or ETH-USDT
- Timeframe or candlestick interval, such as 1m, 5m, 15m, 1H, 4H, or 1D
- Chart type, such as candlestick, line, area, or Heikin Ashi
- Applied indicators and their parameter settings
- Drawings such as trendlines, Fibonacci retracements, horizontal lines, rectangles, and annotations
- Visual settings such as colour scheme, grid visibility, scale type, and price scale position
- Multi-chart arrangement, where applicable
AutoSave
With AutoSave enabled, your active Chart Layout keeps saving changes in the background as you work. This helps preserve your latest chart setup without requiring you to manually save every small change.
AutoSave is especially usefAuul when you adjust drawings, change indicators, or fine-tune your workspace during analysis.
Note: At least one saved layout is required for cross-device sync. If no layout is saved, your chart state may be lost on refresh, login, or device switch.
Indicator Templates
Indicator Templates let you save a reusable group of indicators with their settings and styling. Instead of adding the same indicators manually every time, you can save them once and apply the setup to any chart.
For example, if you regularly use RSI, MACD, EMA 20, EMA 50, and Volume, you can save this combination as an Indicator Template. The next time you analyse another trading pair, you can apply the same indicator stack in one step.
Indicator Templates are useful for traders who follow the same technical setup across different markets.
Drawing Templates
Drawing Templates let you save the style of a drawing tool. This means you do not have to restyle every trendline, Fibonacci retracement, horizontal line, or rectangle manually.
A Drawing Template can save details such as:
- Line colour
- Line width or thickness
- Line style
- Fill colour and opacity
- Text or label settings
- Fibonacci levels
- Line extension settings
For example, if you prefer using a blue 2px trendline or a specific Fibonacci style, you can save it as a Drawing Template and reuse it later.
How to Access Chart Layouts, Indicator Templates, and Drawing Templates
You can access these features directly from the CoinDCX chart screen.
Chart Layouts: Go to the chart toolbar and click the Manage Layouts icon, available through the Save button and dropdown. From here, you can save or load layouts.
Indicator Templates: Open the Indicators panel and click the Templates button. From here, you can save a new indicator template or apply an existing one to your chart.
Drawing Templates: Apply a drawing on the chart, click the drawing, and open the Templates button. You can then save the drawing style as a template.
AutoSave: On the Web, right-click on the chart, go to Chart Settings, and use the AutoSave toggle.
How to Save a Chart Layout on Web
Follow these steps to save a Chart Layout on CoinDCX Web:
- Open any chart on CoinDCX Web.
- Set your preferred symbol, timeframe, indicators, drawings, and visual settings.
- Click the Manage Layouts icon from the chart toolbar.
- Select Save.
- Name your layout and confirm.
Once saved, you can load the same layout later instead of rebuilding your chart setup manually.
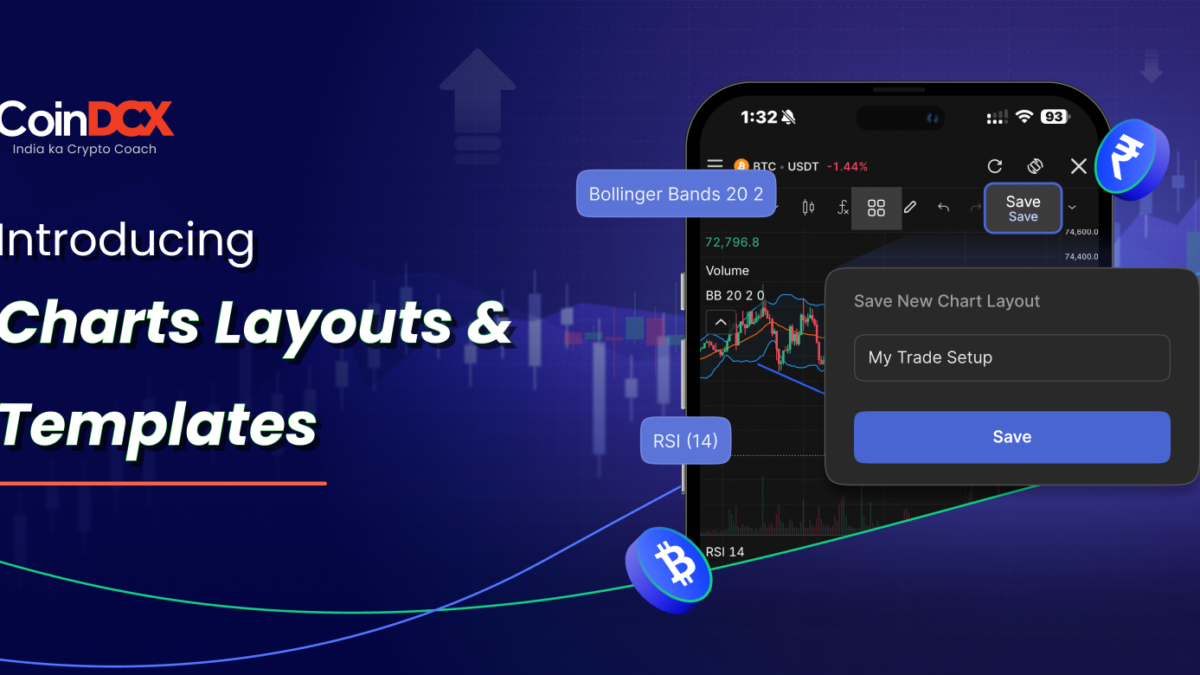
How to Save a Chart Layout on App
Follow these steps to save a Chart Layout on the CoinDCX app:
- Open the CoinDCX app and go to the chart screen.
- Customize the chart with your preferred setup.
- Tap the Save option from the chart title bar.
- Save or load layouts from the layout menu.
This helps traders who analyse on the Web and continue tracking or trading on Mobile.
How to Save Indicator Templates
Follow these steps to save an Indicator Template:
- Open a chart and add your preferred indicators.
- Configure the indicator parameters and styling.
- Open the Indicators panel.
- Tap the Templates button.
- Save the setup as an Indicator Template.
Once saved, the template can be applied to other charts without adding each indicator again.
How to Save Drawing Templates
Follow these steps to save a Drawing Template:
- Apply a drawing on the chart.
- Customize its colour, thickness, line style, or label settings.
- Click or tap the drawing.
- Open the Templates button.
- Save it as a Drawing Template.
The next time you use the same drawing tool, your saved style can be reused.
Chart Layout vs Indicator Template vs Drawing Template
Although these features work together, they are used for different purposes.
| Feature | What It Saves | Best Used For |
| Chart Layout | Full chart workspace, including symbol, timeframe, indicators, drawings, and visuals | Saving your complete trading setup |
| Indicator Template | A group of indicators with settings and styles | Reusing the same indicator setup across charts |
| Drawing Template | Style settings for a specific drawing tool | Keeping chart drawings visually consistent |
A chart layout is the broadest save option. Indicator templates are useful when you want to apply the same technical setup to multiple charts. Drawing templates are useful when you want your chart markings to look consistent.
Why These Features Matter for Traders
For active traders, charts are a workspace. Rebuilding the same setup after every refresh, login, or device switch can slow down analysis and create unnecessary friction.
Chart Layouts, Indicator Templates, Drawing Templates, and AutoSave help reduce that effort. Scalpers, swing traders, and multi-strategy traders can save different setups, switch faster, and maintain consistency across sessions.
These features are also useful for traders who analyse on the Web and continue tracking markets on Mobile. Instead of starting from scratch, they can return to a familiar setup and focus on market movement.
In short, CoinDCX chart layouts help traders spend less time rebuilding charts and more time analysing the market.
FAQs
Q1. What is a Chart Layout on CoinDCX?
A Chart Layout is a saved version of your full chart workspace. It can include the trading pair, timeframe, chart type, indicators, drawings, visual settings, and multi-chart arrangement.
Q2. Do Chart Layouts sync across Web and Mobile?
Yes. Saved Chart Layouts can sync across Web and Mobile, helping you access your preferred chart setup across devices.
Q3. What is an Indicator Template?
An Indicator Template is a saved preset of one or more indicators with their parameter and styling settings. It helps you apply the same indicator setup to any chart.
Q4. What is a Drawing Template?
A Drawing Template is a saved styling preset for a drawing tool such as a trendline, Fibonacci retracement, horizontal line, or rectangle.
Q5. Do I need to save a layout for sync to work?
Yes. You need at least one saved Chart Layout for cross-device sync. If no layout is saved, your chart setup may be lost on refresh, login, or device switch.
Q6. Where can I turn AutoSave on or off?
On the Web, right-click on the chart, go to Chart Settings, and use the AutoSave toggle.
Q7. Are instant order placement settings saved in Chart Layouts?
No. Instant order placement settings are not saved inside Chart Layouts. They remain linked to the user or account level, not to individual layouts.

