This guide provides a Terra crypto price prediction using technical indicators such as RSI, MACD, and moving averages. Explore LUNA price forecasts for today, this week, and the long term through 2040, along with key support and resistance levels, momentum analysis, and market outlook. Whether you are tracking short-term price action or evaluating future potential, this forecast offers a data-driven view of Terra’s expected performance.
Terra (LUNA) is currently trading near $0.0415 and remains below all four of its key exponential moving averages, as per the latest TradingView chart. The 14-day RSI has recovered to about 41.3 and now sits 4.61 points above its moving average at 36.7, while the 20-day, 50-day, 100-day, and 200-day EMAs are positioned at $0.0423, $0.0456, $0.0508, and $0.0635, respectively. LUNA is trading 1.89% under the 20-day EMA with the daily candle still open, and with the token sitting only about 6% above its all-time low of $0.0393, the current move reads as a stabilisation attempt rather than a confirmed turn.
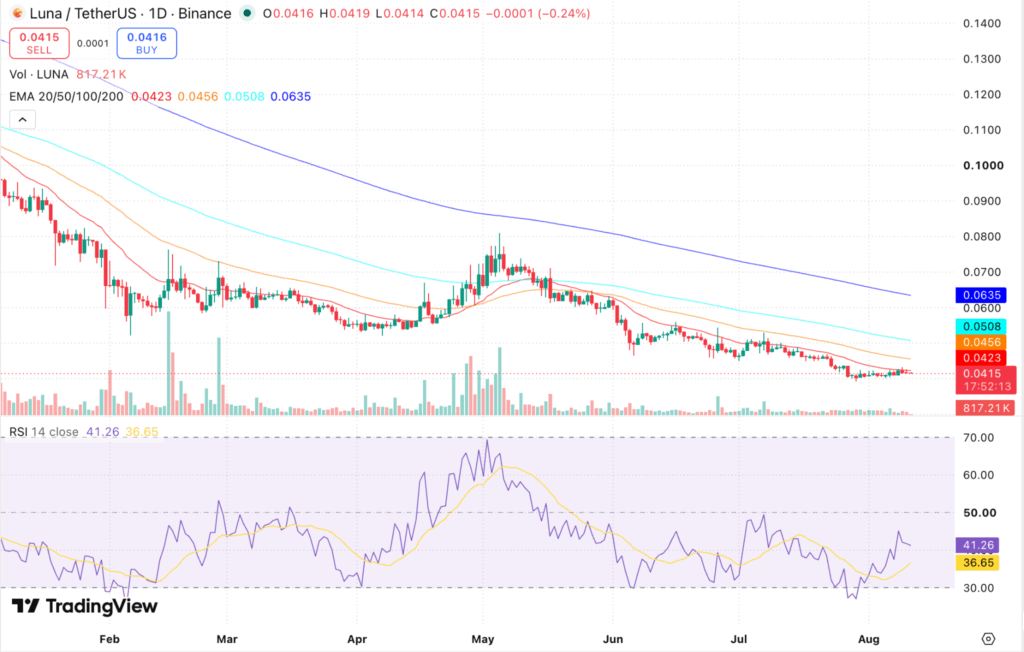
LUNA/USDT daily chart, Source: TradingView
Key Insights
- Short-term outlook: LUNA is 1.89% below the 20-day EMA at $0.0423 and 8.99% below the 50-day EMA at $0.0456. Reclaiming $0.0423 on a daily close is the first thing the chart needs, with $0.0440 the next objective if that level holds.
- Medium to long-term outlook: For the LUNA price prediction 2026, the 100-day EMA at $0.0508 is what separates a relief bounce from a genuine base, and it sits 22.41% overhead. The 200-day EMA at $0.0635 is still falling and needs a 53.01% move, which keeps the broader trend bearish.
- Technical analysis: The MACD has completed a bullish crossover with the histogram at +0.0003, and RSI has moved 4.61 points above its own average. Both signals are occurring below their neutral lines, so they mark decelerating selling rather than fresh demand. All four EMAs remain stacked in descending order, which is the defining feature of this chart.
Additional Read: Terra LUNA vs Terra Classic: A Comparative Analysis
Terra Short-Term Price Prediction: Today, This Week, August 2026
Here is the LUNA price prediction 2026 for today, this week, and August 2026.
| Timeframe | Price Target | Support | Resistance | ROI |
|---|---|---|---|---|
| Next 24 Hrs | $0.0423 | $0.0405 | $0.0430 | +1.93% |
| This Week | $0.0440 | $0.0405 | $0.0456 | +6.02% |
| August 2026 | $0.0456 | $0.0393 | $0.0480 | +9.88% |
Trade LUNA in INR on 
Deposit and withdraw in INR (₹).
No Conversion to Crypto Required.

Terra Price Prediction Today
LUNA is trading near $0.0415 after a quiet session that held a range of barely 1.21% between $0.0414 and $0.0419. The 20-day EMA at $0.0423 sits just overhead, so the next 24 hours come down to whether LUNA can absorb that level and close above it. Immediate support lies at the recent swing low near $0.0405, while $0.0423 followed by $0.0430 forms the resistance overhead.
Don't wait! Click here to buy Luna Coin today.
Terra Coin Price Prediction for This Week
Terra is projected to trade between $0.0405 and $0.0456 this week. LUNA has spent the past three weeks compressing into a narrow band just above its all-time low, and the 20-day and 50-day EMAs are only $0.0033 apart with both still declining. A daily close above $0.0423 would strengthen Terra’s short-term price outlook and put $0.0440 within reach. On the downside, a close below $0.0405 would expose the $0.0393 all-time low, and there is no prior structure beneath that level to lean on.
Terra Price Prediction for August 2026
Terra’s August 2026 price prediction targets $0.0456, with a range of $0.0393 to $0.0480. LUNA has been rejected at the 20-day EMA repeatedly since June, but that average has now fallen to $0.0423 and sits less than 2% overhead, so the gap is closing from both directions. A monthly close above $0.0456 would be the first higher structure LUNA has built since May and would put $0.0480 back in focus. However, if Terra loses $0.0405, the August 2026 outlook turns defensive and the $0.0393 all-time low becomes the level to watch.
Terra Coin Price Prediction for September 2026
Terra’s September 2026 price prediction targets $0.0508, with a range of $0.0420 to $0.0540. If LUNA clears the 50-day EMA at $0.0456 and establishes it as support, buyers may attempt to push price toward the 100-day EMA at $0.0508. A sustained move above $0.0508 could improve the Terra coin price prediction for Q4 2026 and bring the $0.0540 to $0.0590 supply zone into focus. However, if LUNA breaks below $0.0405, the price may retest $0.0393 before any recovery attempt.
Terra Price Prediction 2026 (Medium Term)
| Month | Price Target | Support | Resistance | ROI |
|---|---|---|---|---|
| Aug 2026 | $0.0456 | $0.0393 | $0.0480 | +9.88% |
| Sep 2026 | $0.0508 | $0.0420 | $0.0540 | +22.41% |
| Oct 2026 | $0.0540 | $0.0456 | $0.0590 | +30.12% |
| Nov 2026 | $0.0580 | $0.0490 | $0.0635 | +39.76% |
| Dec 2026 | $0.0635 | $0.0520 | $0.0700 | +53.01% |
Terra’s 2026 price range is projected at $0.0393 to $0.0700 based on the latest EMA structure. The 20-day EMA at $0.0423 is the level LUNA must reclaim first, and it is falling toward price rather than running away from it, while the 200-day EMA at $0.0635 remains the major resistance to clear. For LUNA to confirm a stronger bullish reversal, it must close above $0.0508 and then take out $0.0635. Until then, the Terra price prediction stays cautious, and with LUNA carrying a market capitalization under $30 million, even modest flows can move price sharply in either direction.
Want to diversify beyond Terra? Check out the Top 10 Cryptos To Invest In 2026
Terra Price Prediction in INR (2026–2030)
For Indian traders, here is what the LUNA price targets translate to in rupees.
| Period | LUNA Target USD | LUNA Price INR est. |
|---|---|---|
| August 2026 | $0.0456 | ₹4.34 |
| December 2026 | $0.0635 | ₹6.05 |
| 2027 | $0.0850 | ₹8.09 |
| 2030 | $0.1800 | ₹17.14 |
INR estimates based on a USD/INR rate of ~₹95.2. Rate fluctuations will affect actual INR values; verify at the time of trade.
LUNA to INR: Terra Price in Indian Rupee
1 LUNA = $0.0415 ≈ ₹3.95 (at USD/INR ≈ ₹95.2)
| LUNA (USD) | LUNA Price in INR (Approx) |
|---|---|
| 1 LUNA | ₹3.95 |
| 5 LUNA | ₹19.75 |
| 10 LUNA | ₹39.51 |
| 25 LUNA | ₹98.77 |
| 50 LUNA | ₹197.54 |
| 100 LUNA | ₹395.08 |
Terra Long-Term Price Outlook (2027–2040)
The long-term outlook for LUNA rests on three structural factors: whether the Terra chain can rebuild developer activity and total value locked after the 2022 restructuring, the indirect effect of the 2028 Bitcoin halving cycle on the broader digital asset market, and the pace at which the roughly 40% of total supply still outside circulation is released.
The following forecasts are derived from network-adoption models, broader Bitcoin halving-cycle analysis, and historical LUNA volatility patterns. They represent scenario ranges, not price targets.
| Year | Price Target | Support | Resistance | ROI |
|---|---|---|---|---|
| 2027 | $0.0850 | $0.0500 | $0.1200 | +104.82% |
| 2028 | $0.1100 | $0.0600 | $0.1600 | +165.06% |
| 2029 | $0.1400 | $0.0750 | $0.2000 | +237.35% |
| 2030 | $0.1800 | $0.0900 | $0.2600 | +333.73% |
| 2031 | $0.2100 | $0.1000 | $0.3000 | +406.02% |
| 2035 | $0.3500 | $0.1500 | $0.5500 | +743.37% |
| 2040 | $0.5500 | $0.2200 | $0.9000 | +1225.30% |
Where Will Terra (LUNA) Price Go in 2030?
Terra’s 2030 price prediction targets $0.1800, within a range of $0.0900 to $0.2600, with the 2028 halving cycle providing broader market support. The outcome depends far more on whether the chain attracts sustained application activity than on market beta. Even the upper end of that range would still leave LUNA more than 98% below its 2022 peak, which is the honest scale of the recovery being modelled here.
Where Will Terra (LUNA) Price Go in 2031?
The Terra price prediction for 2031 targets $0.2100, with a range of $0.1000 to $0.3000, as the market enters the post-2028 halving digestion phase. Cycle analysis suggests 2031 may either consolidate from a 2030 peak or build a new base. Staking participation and the rate at which non-circulating supply enters the market are the key on-chain signals to monitor.
Where Will Terra (LUNA) Price Go in 2040?
By 2040, Terra’s price is projected at $0.5500, ranging from $0.2200 to $0.9000, assuming the network sustains a working developer base and a functioning application layer. A fourteen-year horizon on a network of this size carries very high uncertainty, and the scenario in which LUNA fails to hold a developer base is at least as plausible as the upside. These forecasts should be read as scenario ranges, not fixed targets.
Terra Technical Analysis
The following technical indicators were used to derive the Terra price prediction above.
| Indicator | Value | Signal |
|---|---|---|
| Relative Strength Index (14-Day RSI) | 41.26 | Recovering, 4.61 points above its MA |
| RSI Moving Average | 36.65 | Crossover holding, still under 50 |
| 20-Day EMA | $0.0423 | Immediate resistance, 1.89% overhead |
| 50-Day EMA | $0.0456 | Second resistance, 8.99% overhead |
| 100-Day EMA | $0.0508 | Major resistance, 18.31% overhead |
| 200-Day EMA | $0.0635 | Long-term resistance, still falling |
| MACD | -0.0012 (signal -0.0015) | Histogram +0.0003, bullish cross below zero |
| Trading Volume, session to date | 817.21K LUNA | Candle roughly 26% complete |
Relative Strength Index (RSI)
The 14-day RSI has climbed to about 41.3 and now sits 4.61 points above its own moving average at 36.7, extending the crossover established in early August. The reading is still below the neutral 50 line, so momentum has improved off oversold conditions without turning positive. Holding above 40 on the next pullback would strengthen the Terra price prediction, while a slip back under 35 would suggest the bounce off the all-time low has been sold into.
Moving Averages: 20-Day, 50-Day, 100-Day and 200-Day EMA
LUNA is trading 1.89% below its 20-day EMA at $0.0423 and 8.99% below the 50-day EMA at $0.0456, with all four averages declining and stacked in descending order from the 200-day down to the 20-day. That arrangement is the textbook signature of a sustained downtrend and it has been intact since May. The 20-day and 50-day EMAs are $0.0033 apart and that gap has been narrowing, which is the compression that usually precedes a directional resolution. Overhead, the 100-day EMA at $0.0508 sits 18.31% above price and the 200-day EMA at $0.0635 sits 34.65% above it, so both continue to define the broader trend.
MACD (Moving Average Convergence Divergence)
The daily MACD has completed a bullish crossover. The MACD line has risen to -0.0012 while the signal line sits at -0.0015, leaving the histogram at +0.0003 and holding green. The qualifier that matters is that both lines remain below the zero line, so this is a crossover inside negative territory: it marks decelerating selling pressure rather than the arrival of committed buyers. A move of the MACD line above zero alongside a daily close over $0.0423 would give the Terra price prediction two confirmations at once, and neither has arrived yet.
Volume Analysis
The current daily candle is only about 26% complete, with roughly 817.21K LUNA traded so far, so it cannot be compared against a finished session. Turnover across the past three weeks has been visibly thinner than through the May rally, and on a token with a market capitalization under $30 million that matters more than usual, since thin books amplify moves in both directions. The session range so far is 1.21% between $0.0414 and $0.0419. A close above $0.0423 on expanding volume would carry far more weight than one that simply drifts across the line.
What Is the Terra Price Prediction for Indian Traders?
Terra runs as a community-governed proof-of-stake chain with no algorithmic stablecoin, which is the core distinction from Terra Classic and its LUNC token. For Indian traders the practical read is that LUNA is a small-cap recovery play rather than an established Layer-1: market capitalisation sits near $29 million on a circulating supply of roughly 710 million LUNA, and about 40% of total supply is still outside circulation, so dilution is a live risk alongside price risk.
Indian traders can buy, sell, and trade LUNA directly on CoinDCX in INR, with no USD conversion and no international transfer required. With LUNA currently near ₹3.95, the entry point relative to the 2030 base case of ₹17.14 represents a potential 4.3x return over four years under the base scenario. The token trading within 6% of its all-time low is a reminder that the downside scenario is equally real.
FAQs
1. What will be the price of 1 Terra LUNA in 2030?
By the end of 2030, the price of 1 Terra LUNA could be around $0.1800, within a scenario range of $0.0900 to $0.2600. That outcome depends on the Terra chain rebuilding sustained developer activity and total value locked.
2. Will Terra LUNA ever hit $10?
Terra LUNA has marked highs close to $20 during its inception and hence the price is believed to revisit these levels somewhere in the near future
3. Is Terra LUNA a safe investment in 2026?
Whether Terra LUNA is a safe investment in 2026 depends entirely on risk tolerance. LUNA is a small-cap asset trading close to its all-time low with roughly 40% of total supply still outside circulation. The technical picture shows early stabilisation rather than a confirmed reversal, and the downside scenario is as live as the upside one.
4. Will Terra LUNA reach $1?
Reaching $1 is not the base case in any of the scenario ranges above. It would require roughly a 24x move from current levels and a market capitalisation many times the present figure. The 2040 upper scenario tops out at $0.9000, so $1 sits just beyond even the most aggressive long-horizon case.
5. Is Terra LUNA the same as Terra Classic (LUNC)?
No. LUNA is the token of the Terra chain launched in May 2022, which runs without an algorithmic stablecoin. LUNC is the token of the original chain, renamed Terra Classic. They are separate networks with separate supplies, separate development activity, and separate prices, and news about one does not apply to the other.
6. Why is Terra LUNA falling?
LUNA has been in a sustained downtrend since May 2026, with price below all four key EMAs and each average stacked in descending order. Thin liquidity on a sub $30 million market capitalisation, limited new application activity on the chain, and the supply still to enter circulation have all weighed on price.
7. What is Terra LUNA's all-time high?
LUNA reached its all-time high of around $19.52 shortly after the chain launched in 2022. Current levels are more than 99% below that figure, so it is not a useful reference point for near-term targets.
8. What is Terra LUNA's all-time low?
LUNA's all-time low is around $0.0393, set in early August 2026. The token is currently trading roughly 6% above that level, which is why $0.0405 and $0.0393 are the two supports that matter most on the daily chart.
9. Will Terra LUNA recover?
A Terra recovery would need to start with a daily close above the 20-day EMA at $0.0423, followed by the 50-day EMA at $0.0456 and the 100-day EMA at $0.0508. Until those levels are reclaimed and held, any move higher is a bounce within a downtrend rather than a recovery.
10. How high will Terra LUNA go in 5 years?
By 2031, the scenario range runs from $0.1000 to $0.3000, with a base case of $0.2100. The 2028 Bitcoin halving cycle is the main structural catalyst in that window, though for a network of this size chain-level adoption matters far more than broader market beta.
11. What is the Terra LUNA price prediction for 2026 in INR?
At a December 2026 target of $0.0635 and an approximate USD/INR rate of ₹95.2, LUNA could trade near ₹6.05 by year-end 2026. Indian traders can buy LUNA directly on CoinDCX in INR without any USD conversion.
12. Where can I buy Terra LUNA in India?
Indian traders can buy LUNA directly on CoinDCX in INR, with no USD conversion, no international brokerage, and no currency risk from exchange rate movement. LUNA is available for spot purchase on India's FIU-IND registered digital asset exchange.
13. Can I stake Terra LUNA?
Yes, you can stake LUNA as the Terra chain uses a proof-of-stake consensus model. So, LUNA holders can delegate tokens to validators to earn staking rewards and take part in on-chain governance. Staking rewards vary with network participation and do not offset price risk.
14. What will Terra LUNA be worth in 2040?
Long-term models place LUNA between $0.2200 and $0.9000 by 2040, with a base case of $0.5500. A fourteen-year horizon on a network of this size carries very high uncertainty, and a scenario in which the chain fails to sustain a developer base is at least as plausible as the upside.
Disclaimer: This article is for informational purposes only and does not constitute financial or investment advice. Digital asset markets are highly volatile and prices can change rapidly. Past performance is not indicative of future results. The price predictions above are based on technical and on-chain analysis and should not be construed as investment recommendations. Always conduct your own research before making any trading or investment decisions.