This guide provides a Solana crypto price prediction using technical indicators such as the Relative Strength Index (RSI), moving averages, and trading volume. Explore SOL price forecasts for today, this week, and the long term through 2040, along with key support and resistance levels, momentum analysis, and market outlook. Whether tracking short-term price action or evaluating future potential, this forecast offers a data-driven view of Solana’s expected performance.
Solana (SOL) is currently trading near $120.80 after defending the $119.90 level through an intraday dip to $118.87, as per the latest daily chart. SOL opened at $120.77 and is flat at +0.02% inside a $118.87 to $122.00 range, with the daily candle about 97% complete. The 14-day RSI has eased to 64.07 and slipped back under its own moving average at 64.64, while the 20-day, 50-day, 100-day, and 200-day EMAs sit at $116.30, $106.71, $97.72, and $96.55. Price is above all four, and the 100-day now leads the 200-day by $1.17, extending the stack completed last week.
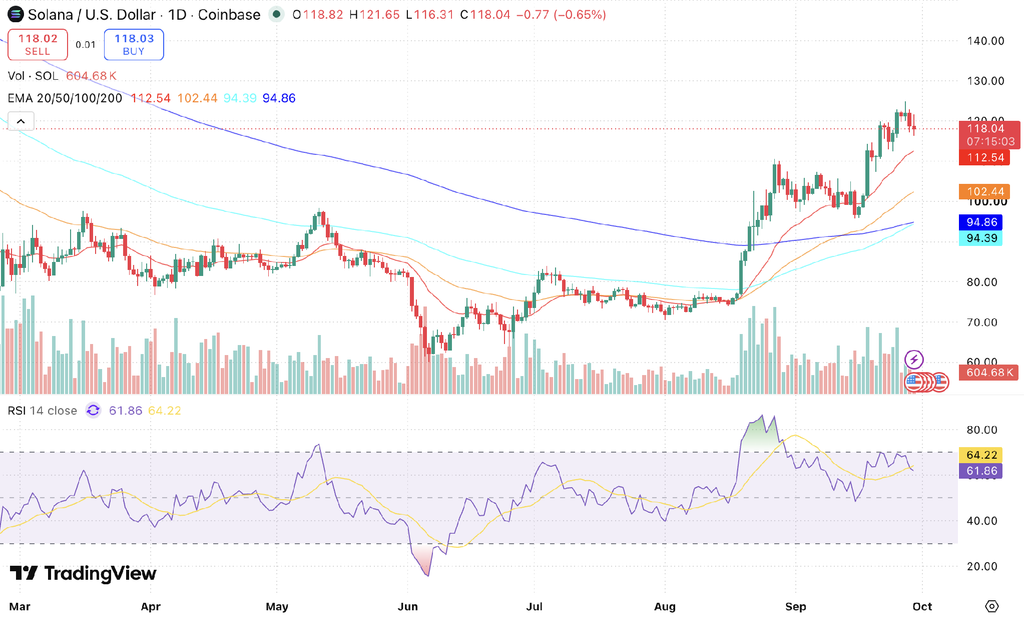
SOL/USD daily chart, Source: TradingView
Key Insights
- Short-term outlook: Price has spent two sessions consolidating under $122.00, and today’s dip to $118.87 was bought back within the day, leaving $119.90 intact on a closing basis with the $124.93 high as the next test. The defense came on the heaviest turnover in over a week. Holding $119.90 remains the immediate task, and below it, the 20-day EMA at $116.30 is the next support.
- Medium to long-term outlook: The 50-day EMA at $106.71 leads the 200-day at $96.55 by $10.16, up from $9.48, and the 100-day at $97.72 has extended its lead over the 200-day to $1.17, deepening the full bullish alignment reached last week. The price cushion has narrowed slightly, with price 25.1% above the 200-day against 26.7% earlier in the week.
- Technical analysis: The 14-day RSI has eased to 64.07 and slipped back under its moving average at 64.64, the second cross in a week and a marginal one at 0.57 points. Turnover has finally picked up, with today’s candle about 97% complete on 431.83K SOL, and a heavy session that produced a flat close with the dip bought back reads as absorption rather than distribution.
Solana Short-Term Price Prediction – Today, This Week, October 2026
Here is the SOL price prediction for today, this week, and October 2026.
| Timeframe | Price Target | Support | Resistance | ROI |
|---|---|---|---|---|
| Next 24 Hrs | $122.00 | $118.87 | $124.93 | +0.99% |
| This Week | $124.50 | $116.30 | $124.93 | +3.06% |
| October 2026 | $126.00 | $116.30 | $134.00 | +4.30% |
Solana Price Prediction Today
The Solana price prediction for today is $122.00, with the price expected to trade between $118.87 and $124.93. Solana is trading at $120.80, flat at +0.02%, which keeps it above the $119.90 breakout level. Today’s low at $118.87 is the nearest support, with the 20-day EMA at $116.30 below it. The $124.93 high represents the first resistance.
Solana Coin Price Prediction for This Week
The Solana price forecast for this week is $124.50, with an expected range of $116.30 to $124.93. The target assumes $119.90 continues to hold on a closing basis and SOL retests the $124.93 high. A daily close above that level opens $130, while a close back under $119.90 shifts the target to the 20-day EMA at $116.30, marking the first real test of the uptrend since late August.
Solana Price Prediction for October 2026
The Solana price target for October 2026 is $126, with an expected range of $116.30 to $134. All four moving averages are rising and the stack is fully aligned, with the 50-day leading the 200-day by $10.16. A close above $124.93 opens $130 to $134. A close below $116.30 points to a retracement toward the 50-day EMA at $106.71.
Read more: How to buy Solana in India
Solana Coin Price Prediction for November 2026
Solana is predicted to reach $130 in November 2026, with an expected range of $116 to $138. The 100-day has already crossed above the 200-day, and the 20-day EMA, rising almost $3 a week from $116.30, should sit near $126 by then, providing a higher structural floor. A close above $134 would set a new cycle high and put $140 in view.
Solana Price Prediction 2026-2027 (Medium Term)
| Month | Price Target | Support | Resistance | ROI |
|---|---|---|---|---|
| Oct 2026 | $126.00 | $116.30 | $134.00 | +4.30% |
| Nov 2026 | $130.00 | $116.00 | $138.00 | +7.62% |
| Dec 2026 | $134.00 | $120.00 | $142.00 | +10.93% |
| Jan 2027 | $136.00 | $123.00 | $145.00 | +12.58% |
Solana’s 2026 price range is projected at $115 to $145 based on the latest EMA structure. The reclaimed $119.90 level has now held through a retest, with today’s dip to $118.87 bought back within the session. Price is above all four moving averages, the 50-day is above the 200-day by $10.16, and the 100-day is above the 200-day by $1.17. The consolidation is also working off the earlier overextension, with price 25.1% above the 200-day after peaking near 28.8% in late September. Momentum has gone quiet rather than negative, with the RSI sitting almost flush with its average, leaving the trend intact and the short-term picture constructive.
Want to diversify beyond Solana? Check out the Top 10 Cryptos To Invest In October 2026
Solana Price Prediction in INR (2026-2030)
SOL currently trades near ₹11,524. Here is what the price targets translate to in rupees.
| Period | SOL Target USD | SOL Price INR est. |
|---|---|---|
| October 2026 | $126.00 | ₹12,020 |
| December 2026 | $134.00 | ₹12,784 |
| 2027 | $138.00 | ₹13,165 |
| 2030 | $170.00 | ₹16,218 |
INR estimates based on a USD/INR rate of ~₹95.4. Rate fluctuations will affect actual INR values.
Solana Long-Term Price Outlook (2027-2040)
Solana is predicted to trade between $138 in 2027 and $300 by 2040. The long-term outlook rests on three structural drivers: Solana’s throughput and fee advantage as a high-performance settlement layer, the 2028 Bitcoin halving cycle and its indirect effect on the broader digital asset market, and institutional adoption through regulated spot products.
The following forecasts are derived from Power Law and network-adoption models, broader Bitcoin halving-cycle analysis, and historical SOL volatility patterns. They represent scenario ranges, not price targets.
| Year | Price Target | Support | Resistance | ROI |
|---|---|---|---|---|
| 2027 | $138.00 | $122.00 | $150.00 | +14.24% |
| 2028 | $144.00 | $130.00 | $155.00 | +19.21% |
| 2029 | $150.00 | $135.00 | $155.00 | +24.17% |
| 2030 | $170.00 | $155.00 | $180.00 | +40.73% |
| 2031 | $185.00 | $168.00 | $195.00 | +53.15% |
| 2035 | $240.00 | $215.00 | $255.00 | +98.68% |
| 2040 | $300.00 | $270.00 | $320.00 | +148.34% |
Where Will Solana Price Go in 2030?
The Solana price prediction for 2030 is $170, with an expected range of $155 to $180. The forecast is supported by the 2028 halving cycle and a trend reversal confirmed on the daily chart. The 50-day EMA sits $10.16 above the 200-day, and the 100-day at $97.72 has crossed above it, completing the moving-average stack for the first time in this cycle. Stock-to-Flow and Power Law models support this range under continued network growth, with faster adoption pushing toward the upper bound.
Where Will Solana Price Go in 2031?
The Solana price target for 2031 is $185, with an expected range of $168 to $195. The market enters the post-2028 halving digestion phase in this period, and cycle analysis suggests 2031 may mirror the 2021 pattern, either consolidating from a 2030 peak or building a new base. Validator participation and total value locked remain the key on-chain signals to monitor.
Where Will Solana Price Go in 2040?
The Solana price forecast for 2040 is $300.00, with an expected range of $270.00 to $320.00. Solana’s price at the upper bound would sit just above the all-time high of $293.31 set in January 2025, so the scenario assumes the asset reclaims and holds beyond its previous peak. Metcalfe’s Law and Power Law models support this range under moderate adoption, while aggressive scenarios exceed $320. These forecasts carry high uncertainty and should be read as scenario ranges, not fixed targets.
Solana Technical Analysis
The following technical indicators were used to derive the Solana price prediction above.
| Indicator | Value | Signal |
|---|---|---|
| Relative Strength Index (14-Day RSI) | 64.07 | Easing, slipped back under its average |
| RSI Moving Average | 64.64 | Marginally above RSI, momentum flat |
| 20-Day EMA | $116.30 | Support, $4.50 below spot |
| 50-Day EMA | $106.71 | Golden cross widened to $10.16 |
| 100-Day EMA | $97.72 | Now $1.17 above the 200-day |
| 200-Day EMA | $96.55 | Price 25.1% above, down from 26.7% |
| Trading Volume | ~431.83K SOL so far | Session about 97% done |
Relative Strength Index (RSI)
The 14-day RSI has eased to 64.07 from 66.08 and slipped back under its moving average at 64.64, the second cross in a week, this time by a thin 0.57 points. Momentum is flat rather than bearish. RSI in the mid-60s sits well inside uptrend territory and below the overbought levels above 80 that preceded September’s correction. Two marginal crosses in opposite directions inside a week describe a market pausing, not one changing direction, and the price structure above $119.90 has held through both.
Exponential Moving Averages – 20-Day, 50-Day, 100-Day and 200-Day EMA
SOL is trading above all four averages, with the 20-day at $116.30, the 50-day at $106.71, the 100-day at $97.72, and the 200-day at $96.55, with all four sloping upward. The golden cross has widened to $10.16 from $9.48, and the 100-day now leads the 200-day by $1.17 after completing the stack last week. The gap between price and the rising 20-day has tightened to $4.50 from $6.42, and price sits 25.1% above the 200-day compared to 26.7% earlier in the week. The averages are closing the distance to price rather than price falling to meet them, which is what healthy consolidation looks like.
Volume Analysis
Turnover has finally picked up. Today’s candle is about 97% complete with 431.83K SOL traded, the heaviest session in over a week, and it produced a flat close with the morning’s dip to $118.87 fully bought back. This pattern indicates absorption, with sellers testing $119.90 and finding buyers waiting, rather than distribution. A push through $124.93 on similar turnover is needed to confirm fresh buyer demand, whereas a daily close under $119.90 on expanding volume would warn that the consolidation is failing.
What Does the Solana Price Prediction Mean for Indian Traders?
Firedancer and the Alpenglow consensus work remain Solana’s main performance catalysts, and sustained network usage has historically preceded price strength. In rupee terms SOL trades near ₹11,524, up from about ₹7,000 at the start of August. Against the 2030 base case of ₹16,218, that implies roughly a 1.4x return over four years.
Disclaimer: This article is for informational purposes only and does not constitute financial or investment advice. Digital asset markets are highly volatile and prices can change rapidly. Past performance is not indicative of future results.
FAQs
Q1. Will the Solana price ever hit $1000?
Solana reaching $1,000 is unlikely within the timeline this forecast covers. It would require a gain of more than eight times from current levels and would place the token well above the $270 to $320 band projected for 2040. A move of that magnitude would require multiple sustained bull cycles alongside extensive growth in real network usage, fee generation, and institutional inflows.
Q2. What will Solana be worth in 2027?
SOL is projected to trade between $122 and $150 across 2027, with a base case of $138, which works out to roughly ₹13,165 at current conversion rates. That range assumes the trend structure built through August holds and the network keeps adding users and validators. A broader market downturn would push SOL toward the lower end of the band, while faster institutional adoption through regulated spot products would test the upper end.
Q3. What will be the price of 1 SOL in 2030?
1 SOL is forecast to trade between $155 and $180 in 2030, with a base case of $170, or close to ₹16,218 at the conversion rate used in this forecast. The estimate draws on post-2028 halving cycle liquidity, growth in Solana's settlement activity, and Power Law adoption models.
Q4. Is Solana a safe investment?
Solana is safer than most cryptocurrencies but riskier than any conventional investment, and it should be sized accordingly. It offers deep liquidity, an active developer base, and a functioning fee market, and the outages that marked earlier cycles have grown less frequent with technical maturity. What remains is the volatility of a growth asset, where deep drawdowns within a cycle are routine. Investors should plan positions around that and track key support levels like the 20-day EMA before allocating capital.
Q5. What was Solana’s highest price?
Solana’s highest price to date is $293.31, recorded on January 19, 2025. SOL currently trades near $120.80, leaving it about 59% below that peak. Long-term scenario modeling through 2040 anticipates price testing and reclaiming that historical high rather than expanding significantly beyond it.