


RedStone’s native token RED is gaining strong momentum after a sharp 58% surge, driven by rising volume and investor interest. This analysis covers RED price predictions for daily, weekly, and April-May 2026, along with key support and resistance levels, technical indicators, and long-term forecasts up to 2031, highlighting potential growth trends and future price targets.
Key Takeaways
- Current Status: RedStone’s token RED is trading near $0.169, indicating a strong intraday increase of over 58%. The price rise is mainly due to surging investor interest, rising trading volume, and increased exchange presence of the coin across various exchanges. Along with positive community sentiment and the ongoing development of the RedStone ecosystem, the momentum has been given a boost, making RED capable of holding on to its position among the major gainers on the market today.
- Market Performance: RedStone has exploded in the short term; its market cap exceeded $58 million, and its 24-hour volume rose significantly. Liquidity remains at a good level across most exchanges, indicating that traders are very active. The token’s fully diluted valuation is also rising, currently standing at $169 million, indicating bullish sentiment in the market. A high volume-to-market cap ratio also suggests continued trading activity and speculation in RED.
- Technical Analysis: RED is gathering strength ahead of the next move and is currently trading comfortably above key short-term moving averages, such as the 20 EMA. The RSI level at nearly 53 indicates neutral market momentum, as it has recently dropped from overbought territory. In fact, MACD is indicating a possible bearish crossover, which might mean a slowdown in momentum. Nevertheless, solid support at $0.15 and resistance in the $0.18-$0.20 range are the key levels, and price stability might signal continuation of the uptrend.
- RedStone Price Prediction April 2026: With strong volume growth and bullish sentiment, the RedStone price prediction model suggests that the RED price could increase by almost 18% and might reach $0.20 by the end of April 2026. This upward movement might be supported by further exchange activity and continued buying pressure. Still, a short-term consolidation period is quite probable before a breakout, particularly if overall conditions in the crypto market remain good over the next few weeks.
- Future Outlook: RedStone (RED) is cautiously optimistic. This is mainly due to its recent price hike of 60-80% and growing institutional adoption, alongside partnerships in the rapidly growing RWA and DeFi sectors. Further oracle integrations and strong trading volume underscore an uptrend in demand; however, token unlocks in the near future and overbought conditions could cause a minor price drop. Persistent adoption within the ecosystem, along with a well-balanced supply, will enable the progressive development of RED. The asset is expected to achieve its long-term price target of $0.70 to $1.00 in favorable conditions.
Trade RED in INR on ![]()
Deposit and withdraw in INR (₹).
No Conversion to Crypto Required.

Where Will RedStone Price Head Next?
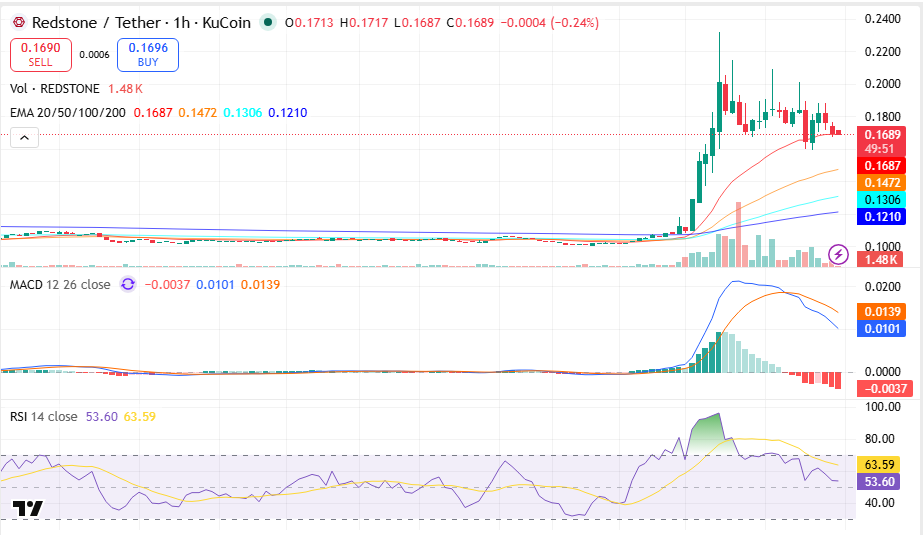
RED/USDT, Source: TradingView
- RedStone is now trading close to its 20-day EMA, which at a glance reflects that the market has been consolidating in the short term after a strong rally. The price staying above important moving averages indicates that there is still a strong underlying buying support sustaining the uptrend, even though momentum has lately weakened.
- The EMA arrangement remains positive, as the 20 EMA is above the 50, 100, and 200 EMAs. Price action sticking above the $0.16 support will be necessary for the triple moving average configuration to support an ongoing rally.
- MACD data points to weakening bulls because the MACD line has crossed below the signal line. The negative crossover indicates the market could see a short-term price pullback or remain sideways until the next substantial move unfolds.
- The RSI currently stands in the 50-55 range, indicating the market remains in equilibrium between buying and selling. This situation enables RED to either advance toward resistance levels or retreat to test support levels because there is no pressure to move into overbought or oversold conditions.
RED/USD Technical Overview – 2026
| Indicator | $ Value |
|---|---|
| Support levels (Fibonacci, S1/S2/S3) | $0.1500 / $0.1350 / $0.1200 |
| Resistance levels (Fibonacci, R1/R2/R3) | $0.1800 / $0.2000 / $0.2200 |
| 20-day EMA | $0.1687 |
| 50-day EMA | $0.1472 |
| 100-day EMA | $0.1306 |
| 200-day EMA | $0.1210 |
| MACD level (Signal Line) | MACD: -0.0037 / Signal Line: 0.0101 |
RedStone Price Prediction Daily
RedStone might see only mild bullish momentum as it holds steady above the $0.16 support level. Judging from the current price movement and the sideways near important EMAs, the coin could rise by about 4% to $0.176 over the next 24 hours. Continued buying power and positive markets may help this short-term rise; falling below $0.16 could trigger a few down moves before bouncing back.
Read: How to buy RedStone coin
Disclaimer: RedStone coin price predictions are speculative. Markets are volatile; do your own research before investing.
RedStone Price Prediction Weekly
Over a week, there is a chance that RedStone will have a smooth upward move, helped by being technically better and having more volume. Price might rise by nearly 9% and possibly reach $0.185 by the weekend. Holding above the $0.15 support level will be crucial for maintaining bullish momentum, while a breakout above $0.18 could accelerate gains and attract fresh buying interest.
Disclaimer: RedStone coin price predictions are speculative. Markets are volatile; do your own research before investing.
RedStone Price Prediction April 2026
RedStone will undergo a period of consolidation in April 2026 before attempting to break through higher resistance levels. The price will increase by approximately 18% to $0.20 by the end of April 2026, driven by improved market sentiment and stable EMA alignment. The upward price movement will depend on volume support and market conditions, while resistance rejection will create a temporary delay in the upward movement.
RedStone Price Prediction May 2026
RedStone will use its April momentum to reach higher resistance zones during May 2026. The price is projected to increase by nearly 25% and may reach $0.21 by the end of May 2026. Strengthening market sentiment, combined with sustained accumulation, may drive this move. The market will experience volatility, and support near $0.17 will be crucial in demonstrating ongoing bullish momentum.
RedStone Coin Price in INR
| RED Amount | Price in INR (Approx) |
| 1 RED | ₹14.50 |
| 5 RED | ₹72.50 |
| 10 RED | ₹145.00 |
| 25 RED | ₹362.50 |
| 50 RED | ₹725.00 |
| 100 RED | ₹1,450.00 |
RedStone Price Prediction Table (2026-2031)
| Year | Min Price ($) | Min (₹) | Avg Price ($) | Avg (₹) | Max Price ($) | Max (₹) | ROI (Avg %) |
| 2026 | 0.12 | ₹10.4 | 0.18 | ₹15.6 | 0.25 | ₹21.6 | — |
| 2027 | 0.20 | ₹17.3 | 0.30 | ₹26.0 | 0.40 | ₹34.7 | +66% |
| 2028 | 0.28 | ₹24.3 | 0.42 | ₹36.4 | 0.55 | ₹47.7 | +133% |
| 2029 | 0.35 | ₹30.3 | 0.55 | ₹47.7 | 0.75 | ₹65.0 | +205% |
| 2030 | 0.50 | ₹43.3 | 0.75 | ₹65.0 | 1.00 | ₹86.7 | +316% |
| 2031 | 0.70 | ₹60.7 | 1.00 | ₹86.7 | 1.40 | ₹121.4 | +455% |
