This Quant price analysis covers short-term and long-term QNT trends with daily, weekly, 2026, 2030, and 2040 forecasts. This QNT crypto price prediction explores potential price targets, dynamic support and resistance levels, and technical momentum indicators like the Relative Strength Index (RSI), exponential moving averages (EMAs), and volume profiles. Track QNT market direction, key retracement shelves, and future scenarios based on current chart structure.
Quant (QNT) is currently trading at $263.97, as of September 28, 2026. The rally followed The Clearing House selecting Quant to provide the underlying orchestration layer for its US tokenized-deposit network, carrying QNT from near $70 to an intraday peak of $372 in four sessions. The 14-day RSI stands at 87.38, easing from a high near 96 but still sitting 21.92 points above its 14-day signal average at 65.46. The 50-day and 200-day EMAs are positioned at $85.53 and $73.38, respectively. The 20-day EMA has advanced to $113.96, while the 100-day EMA ($75.80) has crossed above the 200-day line to confirm a bullish moving average sequence. Based on these technical indicators, QNT is expected to consolidate between $242.00 and $287.00 while defending initial support around $242.00 before resolving into a second expansion leg or a deeper retracement.
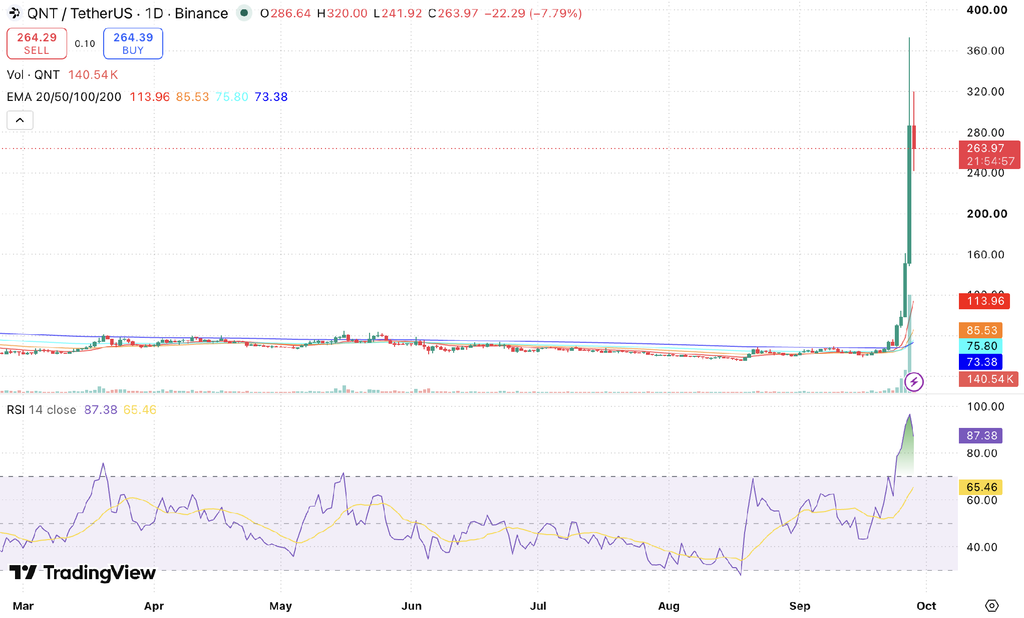
QNT/USDT, Source: TradingView
Key Insights
- QNT is projected to trade within a wide channel of $220 to $320 this week as parabolic momentum normalizes, with the session low at $241.92 serving as the immediate horizontal shelf that buyers must defend.
- For September 2026, QNT targets $260, with $287 acting as overhead resistance. The month is on track to finish well above its opening levels near $70, despite trading 29% below its $372 wick.
- By 2026 and 2030, long-term movement will depend on market cycles and on The Clearing House network going live in the first half of 2027, with all four EMAs now in bullish order after the 100-day crossed the 200-day.
- Current technical analysis: The RSI has eased from a peak near 96 to 87.38 but still sits 21.92 points above its own average, so overbought risk remains the dominant short-term signal.
Trade QNT in INR on 
Deposit and withdraw in INR (₹).
No Conversion to Crypto Required.

Quant Short-Term Price Prediction: Today, This Week, September 2026
Here is the Quant (QNT) price prediction 2026 for today, this week, and September 2026.
| Timeframe | Price Target | Support | Resistance | ROI |
|---|---|---|---|---|
| Next 24 Hrs | $270 | $242 | $287 | +2.28% |
| This Week | $255 | $220 | $320 | -3.40% |
| September 2026 | $260 | $230 | $320 | -1.50% |
QNT Price Prediction Today
Based on the technical analysis, Quant will reach $270 in the next 24 hours. Support is $242 and resistance is $287. If $242 breaks, the next support is $220. The session low of $241.92 has already been bought, and price has recovered 9.1% from it.
Quant Price Prediction for This Week
QNT is projected at $255 this week, with the range running from $220 to $320. Spot price has retraced 29% from its $372 peak and currently hovers just above the 38.2% Fibonacci retracement of the entire expansion near $257.00. Because the 20-day EMA at $113.96 sits far beneath spot, horizontal retracement levels carry primary technical significance. A daily close above $287.00 would indicate that the initial pullback represents consolidation rather than an intermediate cycle top.
QNT Price Prediction for September 2026
As the token trades 259.7% above the 200-day EMA and 131.6% above the 20-day, an extension like that rarely holds for long. For QNT, price targets for September should close near $260, in a band of $230 to $320. QNT is 259.7% above the 200-day EMA at $73.38 and 131.6% above the 20-day, an extension that rarely holds for long. The $287 close of the breakout session is now resistance, and $372 marks the top of the range. A close under $230 would put the 50% retracement near $221 in play.
Quant Price Prediction for October 2026
QNT is predicted to reach $235 by the end of October 2026, in a range of $185 to $300. Technical trajectory depends on whether buyers can reclaim and hold above $287. If selling pressure continues to unwind the spike, key demand rests at $221, followed by $185, which represents the foundational shelf protecting the broader breakout.
Read Also: How to buy Quant in India
QNT Price Prediction 2026 (Medium Term)
| Month | Price Target | Support | Resistance | ROI |
|---|---|---|---|---|
| Sep 2026 | $260 | $230 | $320 | -1.50% |
| Oct 2026 | $235 | $185 | $300 | -10.97% |
| Nov 2026 | $250 | $200 | $320 | -5.29% |
| Dec 2026 | $275 | $220 | $345 | +4.18% |
Quant’s medium-term price channel for 2026 is projected at $185 to $345, with a December target of $275. The multi-month $75 to $80 base has been left far below, with the advance reaching levels unseen since 2021. Because moving averages are climbing from deeply discounted levels, structural retracement targets at $221 and $185 serve as primary macro reference points. A confirmed weekly close above $287 would unlock the upper boundary of this range toward $345.
Quant Price Prediction 2026 to 2040 (Long Term)
| Year | Price Target | Support | Resistance | ROI |
|---|---|---|---|---|
| 2027 | $340 | $260 | $420 | +28.80% |
| 2028 | $390 | $300 | $470 | +47.74% |
| 2029 | $440 | $340 | $540 | +66.69% |
| 2030 | $490 | $380 | $600 | +85.63% |
| 2031 | $540 | $420 | $660 | +104.57% |
| 2035 | $700 | $540 | $860 | +165.18% |
| 2040 | $900 | $700 | $1,150 | +240.95% |
Quant 2030 Forecast: What Is the Expected Price?
The 2030 target for QNT is $490, in a range of $380 to $600. Spot price trades above all four daily EMAs, with the 50-day and 100-day lines holding above the 200-day to confirm structural alignment. Reaching this long-term band relies on commercial institutions adopting Overledger in production, successful implementation of The Clearing House network, and broader crypto market cycles.
Quant 2031 Outlook and Expected Price Range
The Quant price prediction for 2031 targets $540, with a range of $420 to $660, assuming QNT holds its breakout zone and The Clearing House network goes live as planned in the first half of 2027. The QNT price outlook remains dependent on sustained momentum on indicators such as the MACD, volume trends, and broader crypto market strength. The current setup, with price 259.7% above the 200-day EMA and the RSI still deep in overbought territory, rests more on a news-driven surge than on settled structure. Long-term projections remain highly uncertain because the supplied chart only shows current technical indicators.
QNT Price Prediction 2040: Long-Term Forecast
By 2040, Quant’s price is projected at $900, ranging from $700 to $1,150, under a long-term adoption scenario. The current chart shows QNT trading 259.7% above its 200-day EMA at $73.38, with all four EMAs below price, so this horizon depends far more on bank and enterprise adoption of Overledger and on market cycles than on present technical structure. The QNT price forecast for 2040 is highly uncertain and should therefore be interpreted as a scenario range rather than a fixed target.
Quant Technical Analysis
The following technical indicators were used to derive the price predictions above.
| Indicator | Value | Signal |
|---|---|---|
| Relative Strength Index (14-Day RSI) | 87.38 | Overbought, cooling |
| 20-Day EMA | $113.96 | Bullish |
| 50-Day EMA | $85.53 | Bullish |
| 100-Day EMA | $75.80 | Bullish |
| 200-Day EMA | $73.38 | Bullish |
| Average Trading Volume (14-Day) | Spiking | Climax risk |
Relative Strength Index (RSI)
The 14-day RSI stands at 87.38, easing from its peak near 96 on the breakout candle but remaining 21.92 points above its signal average at 65.46. The oscillator turning downward marks the first sign of momentum deceleration following the vertical expansion. With the moving average climbing rapidly, the spread is expected to narrow. A decline beneath the 70 threshold would confirm that the overbought impulse has completed, while reclaiming 90 alongside a daily close above $287 would signal an immediate second expansion leg.
Exponential Moving Averages (50-Day and 200-Day EMA)
QNT trades 259.7% above its 200-day EMA at $73.38, with all four EMAs below price and now stacked in bullish order. The headline development is the crossover sequence: before the breakout, the 50-day and 100-day both sat under the 200-day near $68, and both have since crossed above it, with the 50-day at $85.53 and the 100-day at $75.80. The 20-day at $113.96 is $40.58 clear of the 200-day. Price is 131.6% above the 20-day, a stretch that usually resolves through time or through price, and the 20-day will climb quickly as the spike ages. Only a daily close under $185 would put the breakout structure back in question.
Volume Analysis
Quant’s turnover exploded through the breakout, with the daily bars building across four sessions and the $372 session printing the largest bar on the chart by a wide margin. Volume that spikes this hard on a vertical move often marks a climax rather than a starting point, and today has already logged 140.54K QNT in its opening hours on the pullback. The reading to watch is whether selling volume fades as price holds above $242, since a quiet pullback would point to profit-taking rather than a rush for the exit.
Disclaimer: This article is for informational purposes only and does not constitute financial or investment advice. Crypto markets are highly volatile. Always do your own research (DYOR) before making any investment decisions.
FAQs
Can Quant (QNT) reach $1,000?
Not within the horizon of this analysis. A $1,000 QNT is a 3.8x move from $263.97 and implies a fully diluted valuation near $14.6 billion on the fixed 14.61 million supply, against roughly $3.86 billion today. That sits above the $900 this analysis projects for 2040 and more than double the $427.42 all-time high from 2021, so neither the chart nor the supply math supports it.
How much will Quant be worth in 2030?
This analysis projects QNT at $490 in 2030, within a range of $380 to $600, an 85.63% return from $263.97. This trajectory assumes that The Clearing House network launches on schedule in 2027 and that QNT preserves structural support above its $185 macro breakout floor.
Can QNT reach $500?
Yes, but not in the near term. A $500 QNT is a 1.9x move from $263.97 and implies a fully diluted valuation near $7.3 billion, about 17% above the $427.42 all-time high. Because $500 falls within the projected 2030 channel of $380 to $600, it represents a viable late-decade objective under sustained enterprise adoption and supportive market liquidity.
What is the Quant price prediction for tomorrow?
The 24-hour price target for QNT is $270, with support at $242 and resistance at $287, a 2.28% move from $263.97. Price above all four EMAs keeps the structure intact, though the RSI is still 21.92 points above its own average, and today is the first red session after the spike. A daily close under $242 would open a test of $220.
What is the Quant price prediction for 2027?
Most price prediction models project QNT at $340 in 2027, within a range of $260 to $420, a 28.80% return from $263.97. The December 2026 target of $275 is the intermediate step on that path. The launch of The Clearing House tokenized-deposit network in the first half of 2027 is the main catalyst, though delivery, market cycles and regulation will decide the outcome.
What is the Quant price prediction for 2030 in INR?
QNT’s $490 target for 2030 works out to roughly ₹46,750 at a USD-INR rate near ₹95.4. The $380 to $600 range translates to about ₹36,250 to ₹57,250. Those figures move with the exchange rate as well as the QNT price.
What is the Quant price prediction for 2040?
This analysis projects QNT at $900 by 2040, within a range of $700 to $1,150, a 240.95% return from $263.97. Across 14 years that is compound growth of roughly 9% a year, a moderate rate by crypto standards. A 2040 target spans several full market cycles, so it should be read as highly speculative.
How high will QNT go in 2026?
QNT is projected to trade between $185 and $345 through the rest of 2026, with a December target of $275. After the spike to near $372, QNT needs a close back above $287 to open the upper half of that range. QNT has rallied roughly 4.7x from its mid-August low near $56 and still trades about 38% below its $427.42 all-time high.
What will be Quant price prediction 2026 in rupees?
The $185 to $345 range from this analysis works out to roughly ₹17,650 to ₹32,900 at a USD-INR rate near ₹95.4. The December target for QNT is $275 or ₹26,250. At the current $263.97, QNT is worth about ₹25,200.