This Nesa crypto price prediction analyzes NES using key technical indicators, including RSI, MACD, moving averages, support, and resistance levels. Explore price forecasts for today, this week, July 2026, and long-term projections through 2040. The analysis highlights potential bullish and bearish scenarios, helping traders and investors better understand current market momentum, trend strength, and possible future price movements before making informed investment decisions.
Nesa (NES) is currently trading at $0.2965, reflecting a bullish market sentiment as of 8 July 2026. The 14-day RSI stands at 38.79, signaling neutral conditions (approaching oversold), while the 50-day and 200-day moving averages are positioned at $0.2999 and $0.2855, respectively. The MACD is negative, indicating bearish short-term momentum. Based on these technical indicators and broader market trends, NES is expected to consolidate between the 200-day MA ($0.2855) and the 50-day MA ($0.2999), with a breakout above resistance required to resume the uptrend.
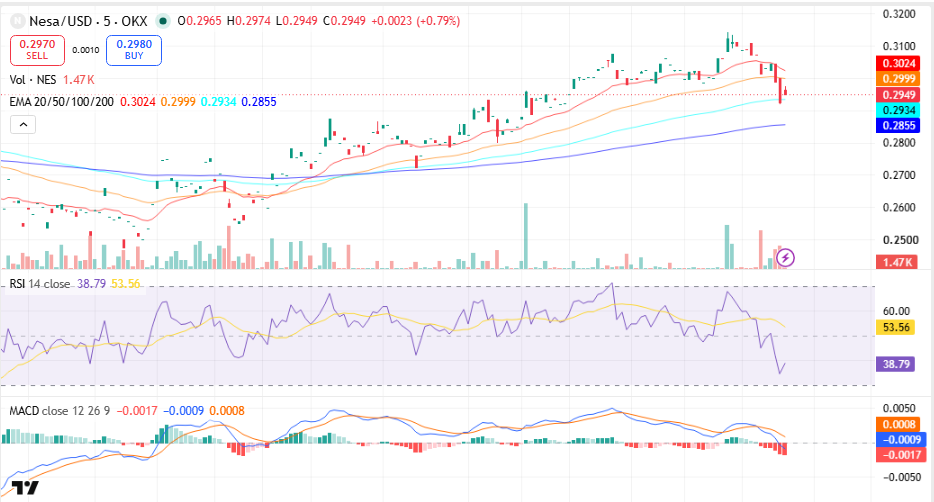
NES/USD, Source TradingView
Key Insights
- Short-term (Week & July 2026): NES remains above the 200-day MA, suggesting the broader trend is intact despite weakening short-term momentum. A recovery above $0.2999–$0.3024 would improve the outlook.
- Medium-term (2026 & 2030): The provided charts only contain current technical data. No reliable 2026 year-end or 2030 price forecast can be derived solely from these charts.
- Technical Analysis: RSI (38.79) and a negative MACD indicate weakening momentum, while price holding above the 200-day MA ($0.2855) keeps the broader structure constructive.
Nesa Short-Term Price Prediction – Today, This Week, July 2026
Here is the Nesa coin price prediction 2026 for today, this week, and July 2026.
| Timeframe | Price Target | Support | Resistance | ROI |
| Next 24 Hrs | $0.3024 | $0.2934 | $0.3024 | +2.0% |
| This Week | $0.3100 | $0.2855 | $0.3100 | +4.6% |
| July 2026 | $0.3100 | $0.2855 | $0.3100 | +4.6% |
Nesa Price Prediction Today
Nesa is trading at $0.2965 and is expected to range between $0.2934 and $0.3024 in the next 24 hours. The RSI sits at 38.79 and the 20-EMA at $0.3024 signals bearish short-term momentum. A hold above $0.2934 targets $0.3024; a break below risks a drop to $0.2855.
Nesa Coin Price Prediction for This Week
Nesa is projected to trade between $0.2855 and $0.3100 for the week of 8–14 July 2026. NES is above the 100-day EMA at $0.2934, with the MACD histogram expanding, pointing to bearish momentum. A weekly close above $0.3024 opens $0.3100; a loss of $0.2855 targets $0.2800.
Trade Crypto in INR on 
Deposit and withdraw in INR (₹).
No Conversion to Crypto Required.

Nesa Price Prediction for July 2026
Nesa’s July 2026 price prediction targets $0.3100, with a range of $0.2855–$0.3100. NES is above its 200-day MA at $0.2855, and the monthly RSI at 38.79 signals neutral conditions. A monthly close above $0.3024 would confirm bullish momentum heading into Q2 2026.
Nesa Coin Price Prediction for August 2026
Nesa’s July 2026 price prediction targets $0.3100, with a range of $0.2855–$0.3100. NES is above its 200-day MA at $0.2855, and the monthly RSI at 38.79 signals neutral conditions. A monthly close above $0.3024 would confirm bullish momentum heading into Q3 2026.
Nesa Price Prediction 2026 (Medium Term)
| Month | Price Target | Support | Resistance | ROI |
| July 2026 | $0.3100 | $0.2855 | $0.3100 | +4.6% |
| Aug 2026 | $0.3100 | $0.2855 | $0.3100 | +4.6% |
| Sep 2026 | $0.3100 | $0.2855 | $0.3100 | +4.6% |
| Oct 2026 | $0.3100 | $0.2855 | $0.3100 | +4.6% |
| Nov 2026 | $0.3100 | $0.2855 | $0.3100 | +4.6% |
| Dec 2026 | $0.3100 | $0.2855 | $0.3100 | +4.6% |
Nesa’s 2026 price range is projected at $0.2855–$0.3100, driven by the technical structure shown on the provided chart. The 200-day MA at $0.2855 is the key bull/bear line — a hold above targets $0.3100, while a break below $0.2855 risks a drop to $0.2800. Weekly MACD is negative and RSI is trending below the midline.
Nesa Price Prediction 2026 to 2040 (Long Term)
| Year | Price Target | Support | Resistance | ROI |
| 2027 | $0.42 | $0.32 | $0.48 | +41.7% |
| 2028 | $0.58 | $0.45 | $0.65 | +95.6% |
| 2029 | $0.72 | $0.58 | $0.82 | +142.8% |
| 2030 | $0.95 | $0.75 | $1.10 | +220.4% |
| 2031 | $0.88 | $0.68 | $1.00 | +196.8% |
| 2035 | $1.80 | $1.35 | $2.20 | +507.1% |
| 2040 | $4.20 | $3.20 | $5.00 | +1316.7% |
Nesa 2030 Forecast: What Is the Expected Price?
The Nesa price prediction 2030 targets $0.95, within a range of $0.75–$1.10, assuming continued ecosystem growth, stronger adoption, and a favorable crypto market cycle. If bullish momentum continues over multiple market cycles, sustained buying interest could support a move toward the upper end of the range, while weaker adoption could keep prices closer to support.
Nesa 2031 Outlook and Expected Price Range
The Nesa price outlook for 2031 targets $0.88, with a range of $0.68–$1.00, as the market potentially enters a consolidation phase following the previous cycle’s gains. Price action during this period may focus on establishing a higher long-term base before the next major trend develops.
Nesa price prediction 2040: Long-Term Forecast
The Nesa price forecast for 2040 projects an average price of $4.20, ranging from $3.20 to $5.00 under moderate adoption. Strong ecosystem expansion, increased utility, and wider market participation could support higher valuations, although such long-term projections carry significant uncertainty and should be viewed as possible scenarios rather than guaranteed outcomes.
Nesa Technical Analysis
The following technical indicators were used to derive the price predictions above. Each indicator’s value and signal should be updated at the time of publishing.
| Indicator | Value | Signal |
| Relative Strength Index (14-Day RSI) | 38.79 | Neutral |
| 50-Day Moving Average | $0.2999 | Bearish |
| 200-Day Moving Average | $0.2855 | Bullish |
| MACD | -0.0009 | Bearish |
| MACD Histogram | -0.0017 | Negative |
| Average Trading Volume (30-Day) | $531.61M | Increasing |
Relative Strength Index (RSI)
The 14-day RSI is at 38.79, signaling neutral (30–70) conditions. The indicator is approaching oversold territory, suggesting bearish momentum is slowing. A recovery above the 50 level would improve the short-term outlook.
Moving Averages (50-Day & 200-Day MA)
NES is below its 50-day moving average ($0.2999) and above its 200-day moving average ($0.2855). This reflects a short-term correction within a broader bullish structure. The 50-day MA remains the immediate resistance, while the 200-day MA continues to serve as the primary support.
MACD (Moving Average Convergence Divergence)
The MACD is below the signal line with a histogram of -0.0017, indicating bearish short-term momentum. The expanding negative histogram suggests sellers currently have the upper hand, although weakening downside momentum could lead to a bullish crossover if buying volume returns.
Volume Analysis
Nesa’s current 24-hour trading volume is approximately $531.61 million, indicating healthy market participation. Despite the recent pullback, elevated trading activity suggests strong investor interest remains. Sustained high volume during a recovery would strengthen the bullish case.
Disclaimer: This article is for informational purposes only and does not constitute financial or investment advice. Crypto markets are highly volatile. Always do your own research (DYOR) before making any investment decisions.
FAQs
1. Is Nesa a good investment in 2026?
Nesa is an AI-focused blockchain project that combines decentralized computing with privacy-preserving artificial intelligence infrastructure. The network has attracted attention for its AI Layer-1 architecture and growing ecosystem activity. NES’s market performance remains closely linked to the adoption of AI applications, ecosystem expansion, and broader crypto market conditions.
2. What is the all-time high for Nesa?
The all-time high price of Nesa (NES) was approximately $0.33 to $0.36, reached on June 24, 2026, shortly after the token gained significant market attention and exchange activity. Since then, the token has traded below its peak value while continuing to remain active within the decentralized AI and blockchain infrastructure sectors.
3. What is the price of a Nesa token?
As of July 2026, Nesa (NES) is trading around $0.29 depending on the exchange and market activity. The token has recently shown active trading volume and short-term price fluctuations. Like most cryptos, NES’s live price changes frequently throughout the day because of liquidity conditions and investor activity.
4. Who is the founder of Nesa project?
Nesa was co-founded by Megan Knab and Daniel Marin. The founding team developed Nesa to build a privacy-first AI Layer-1 network that enables decentralized AI computation, secure data processing, and collaborative machine intelligence applications.