
LAB has shown improving momentum, trading above its key moving averages with a positive MACD and a neutral RSI The LAB crypto price prediction highlights the token’s short-, medium-, and long-term outlook using key technical indicators, including RSI, MACD, and moving averages. Discover LAB price forecasts for today, this week, August 2026, and long-term projections through 2040. The analysis also covers major support and resistance levels, momentum trends, and potential price targets to help investors understand LAB’s future market direction.
LAB (LAB) is currently trading at $0.1401, reflecting a neutral market sentiment as of July 28, 2026. The 14-day RSI stands at 44.54, signaling neutral conditions, while the 50-day and 200-day moving averages are positioned at $0.1406 and $0.1420, respectively. The MACD is negative, indicating bearish short-term momentum. Based on these technical indicators and broader market trends, LAB is expected to consolidate between $0.1390 and $0.1420 in the near term, with a breakout above resistance required for a stronger bullish move.
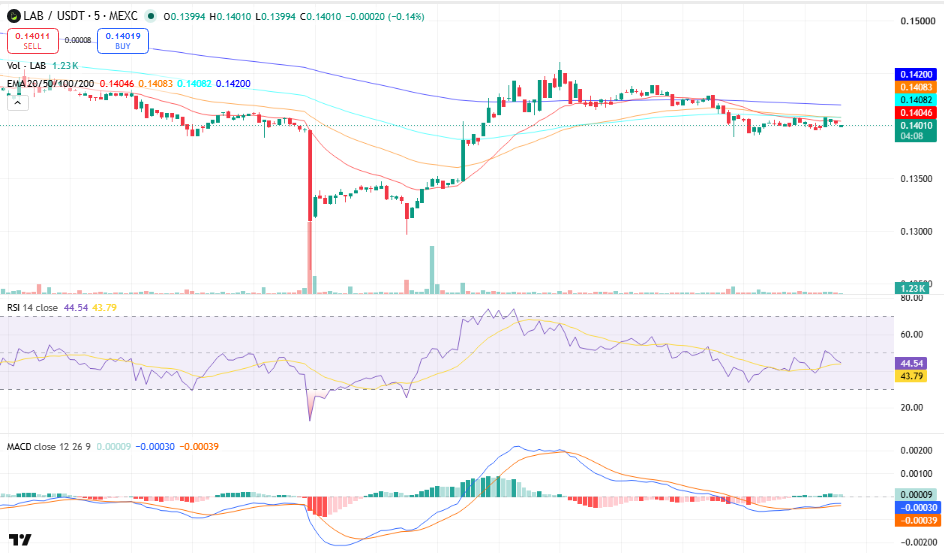
LAB/USDT, Source TradingView
Key Insights
- Weekly & Monthly Outlook: LAB is expected to trade in a narrow range this week, while August 2026 could see a gradual recovery if it reclaims the 200-day EMA near $0.1420.
- Long-Term Outlook: Through 2026 and toward 2030, maintaining support above $0.1380 could strengthen the long-term trend, while sustained moves above $0.1420 would improve bullish momentum.
- Technical Analysis: RSI remains neutral at 44.54, while MACD is still slightly negative. Price is trading below the 50-EMA and 200-EMA, indicating cautious short-term sentiment.
LAB Short-Term Price Prediction – Today, This Week, August 2026
Here is the LAB price prediction 2026 for today, this week, and August 2026.
| Timeframe | Price Target | Support | Resistance | ROI |
| Next 24 Hrs | $0.1415 | $0.1394 | $0.1420 | +1.00% |
| This Week | $0.1420 | $0.1380 | $0.1440 | +1.36% |
| August 2026 | $0.1450 | $0.1380 | $0.1480 | +3.50% |
LAB Price Prediction Today
LAB is trading at $0.1401 and is expected to range between $0.1394 and $0.1415 in the next 24 hours. The RSI sits at 44.54 and the 20-EMA at $0.1404 signals bearish short-term momentum. A hold above $0.1394 targets $0.1420; a break below risks a drop to $0.1380.
Trade LAB in INR on ![]()
Deposit and withdraw in INR (₹).
No Conversion to Crypto Required.

LAB Coin Price Prediction for This Week
LAB is projected to trade between $0.1380 and $0.1420 for the week of July 28-August 3, 2026. LAB is below the 50-day EMA at $0.1406, with the MACD histogram contracting, pointing to bearish momentum. A weekly close above $0.1420 opens $0.1440; a loss of $0.1380 targets $0.1350.
LAB Price Prediction for August 2026
LAB (LAB) is projected to trade around $0.1450 in August 2026, with expected price fluctuations between $0.1380 and $0.1480. The token is currently trading below its 200-day moving average of $0.1420, indicating the broader market trend. Meanwhile, the monthly RSI stands at 44.54, reflecting neutral momentum. If LAB successfully breaks and holds above the $0.1480 resistance level, it could strengthen the bullish outlook over the coming months.
LAB Coin Price Prediction for September 2026
For September 2026, LAB is forecast to reach an average price of $0.1470, while trading within a projected range of $0.1410 to $0.1500. Technical indicators suggest that LAB remains below its 200-day moving average at $0.1420, highlighting its long-term trend. At the same time, a monthly RSI reading of 44.54 points to neutral market conditions. Sustained buying pressure above $0.1480 may pave the way for further upside and reinforce investor confidence during the following months.
LAB Price Prediction 2026 (Medium Term)
| Month | Price Target | Support | Resistance | ROI |
| Aug 2026 | $0.1450 | $0.1380 | $0.1480 | +3.50% |
| Sep 2026 | $0.1470 | $0.1410 | $0.1500 | +4.92% |
| Oct 2026 | $0.1490 | $0.1430 | $0.1520 | +6.35% |
| Nov 2026 | $0.1510 | $0.1450 | $0.1540 | +7.78% |
| Dec 2026 | $0.1530 | $0.1470 | $0.1560 | +9.21% |
LAB’s 2026 price range is projected at $0.1380-$0.1560, driven by improving market sentiment and continued buying interest. The 200-day MA at $0.1420 is the key bull/bear line—a hold above targets $0.1560, while a break below $0.1380 risks a drop to $0.1350. Weekly MACD is negative and RSI is trending below the midline.
LAB Price Prediction 2026 to 2040 (Long Term)
| Year | Price Target | Support | Resistance | ROI |
| 2027 | $0.1700 | $0.1450 | $0.1850 | +21.34% |
| 2028 | $0.2050 | $0.1750 | $0.2250 | +46.32% |
| 2029 | $0.2450 | $0.2100 | $0.2700 | +74.88% |
| 2030 | $0.2950 | $0.2550 | $0.3300 | +110.49% |
| 2031 | $0.2750 | $0.2350 | $0.3050 | +96.15% |
| 2035 | $0.4200 | $0.3600 | $0.4800 | +199.79% |
| 2040 | $0.7000 | $0.6000 | $0.8000 | +399.64% |
LAB 2030 Forecast: What Is the Expected Price?
The LAB price prediction 2030 targets $0.2950, within a range of $0.2550-$0.3300, supported by improving network adoption, stronger liquidity, and broader crypto market expansion. Based on the current technical structure, sustained trading above long-term resistance levels could reinforce the bullish trend. Under continued network growth, long-term valuation models support a range of $0.2600-$0.3300, although actual performance will depend on adoption, market conditions, and investor sentiment.
LAB 2031 Outlook and Expected Price Range
The LAB price outlook for 2031 targets $0.2750, with a projected range of $0.2350-$0.3050 as the market enters a consolidation phase following the previous cycle. Historical cycle behavior suggests 2030 may serve as the reference pattern, where prices either consolidate after a strong advance or establish a fresh long-term base. Long-term holder activity and exchange reserve trends will remain key indicators to monitor.
LAB price prediction 2040: Long-Term Forecast
The LAB price forecast projects an average price of $0.7000 by 2040, with an expected range between $0.6000 and $0.8000. Assuming continued ecosystem growth and broader crypto adoption, long-term valuation models support a range of $0.6000-$0.8000, while highly optimistic scenarios could extend toward $1.0000. These projections remain speculative and should be viewed as long-term scenarios rather than guaranteed outcomes.
LAB Technical Analysis
The following technical indicators were used to derive the price predictions above. Each indicator’s value and signal should be updated at the time of publishing.
| Indicator | Value | Signal |
| Relative Strength Index (14-Day RSI) | 44.54 | Neutral |
| 50-Day Moving Average | $0.1406 | Bearish |
| 200-Day Moving Average | $0.1420 | Bearish |
| MACD | -0.00030 | Bearish |
| MACD Histogram | -0.00039 | Negative |
| Average Trading Volume (24H) | $19.65M | Decreasing |
Relative Strength Index (RSI)
The 14-day RSI is at 44.54, signaling neutral (30-70) conditions. This suggests the market is currently in an indecision phase, with neither buyers nor sellers holding a decisive advantage. The next major price catalyst will likely determine the short-term direction.
Moving Averages (50-Day & 200-Day MA)
LAB is below its 50-day MA at $0.1406 and below its 200-day MA at $0.1420. This reflects a bearish technical structure, with the 200-day moving average acting as the primary resistance level that bulls need to reclaim to improve the longer-term outlook.
MACD (Moving Average Convergence Divergence)
The MACD is below the signal line with a histogram of -0.00039, indicating bearish momentum. Although downside momentum has weakened compared to earlier sessions, buyers have yet to confirm a bullish crossover, suggesting price may continue consolidating over the next few trading sessions.
Volume Analysis
LAB’s average daily trading volume over the past 24 hours is approximately $19.65 million. Recent trading activity appears to be decreasing, indicating weaker conviction behind the current price movement. Unless accompanied by stronger buying volume, the token is likely to remain range-bound near current support and resistance levels.
FAQs
1. What is the LAB token used for?
The LAB coin powers governance and premium feature access on a multi-chain AI trading terminal that supports spot, limit, and perpetual trades across Solana, Ethereum, and BNB Chain. Active traders also earn LAB through a referral and points-based rewards system.
2. What is the LAB coin price prediction for 2026?
LAB price forecasts range from $12 on the low end to $15 on the high end. The base case sits between $10 and $15, contingent on mobile app adoption and whether the token unlock schedule is managed without excess supply pressure.
3. Why did the LAB price crash after hitting $22?
LAB price crashed after hitting ATH on June 2, 2026, due to a intensified social FUD around insider holdings and impending token unlocks, drawing comparisons to failed projects like RaveDAO.
4. Where can I trade LAB token?
You can trade LAB trades at CoinDCX.
5. What is the LAB price prediction for 2030?
Long-term price estimates place LAB between $20 and $22 by 2030, assuming sustained platform growth, DeFi market recovery, and disciplined token supply management. These are scenario ranges, not price targets.
6. Is LAB a good long-term investment in 2026?
LAB has genuine utility as trading infrastructure, but carries significant risk from insider activity, token unlocks, and a short track record. It's better suited to active traders comfortable with high volatility than long-term holders seeking stable appreciation.
Disclaimer
This article is for informational purposes only and does not constitute financial or investment advice. VDA markets are highly volatile and prices can change rapidly. Past performance is not indicative of future results. Always conduct your own research before making any trading or investment decisions. CoinDCX does not endorse any specific token mentioned in this article.

