


This Hedera price analysis covers short-term and long-term HBAR trends with daily, weekly, 2026, 2030, and 2040 forecasts. This crypto price prediction explores potential price targets, dynamic support and resistance levels, and momentum signals using technical indicators like the Relative Strength Index (RSI), exponential moving averages (EMAs), and volume trends. Track market direction, key breakout zones, and future scenarios based on current chart patterns and technical structure.
Hedera (HBAR) is currently trading at $0.11927, reflecting a bullish but overheated market sentiment as of 29 September 2026. The 14-day RSI stands at 76.59, signaling overbought conditions, while the 50-day and 200-day EMAs are positioned at $0.08322 and $0.08750, respectively. The RSI is 10.72 points above its signal line at 65.87, indicating strong short-term momentum that is now stretched after HBAR’s spike to $0.131. Based on these technical indicators and broader market trends, HBAR is expected to test resistance near $0.12300 while maintaining support around $0.11500 in the near term.
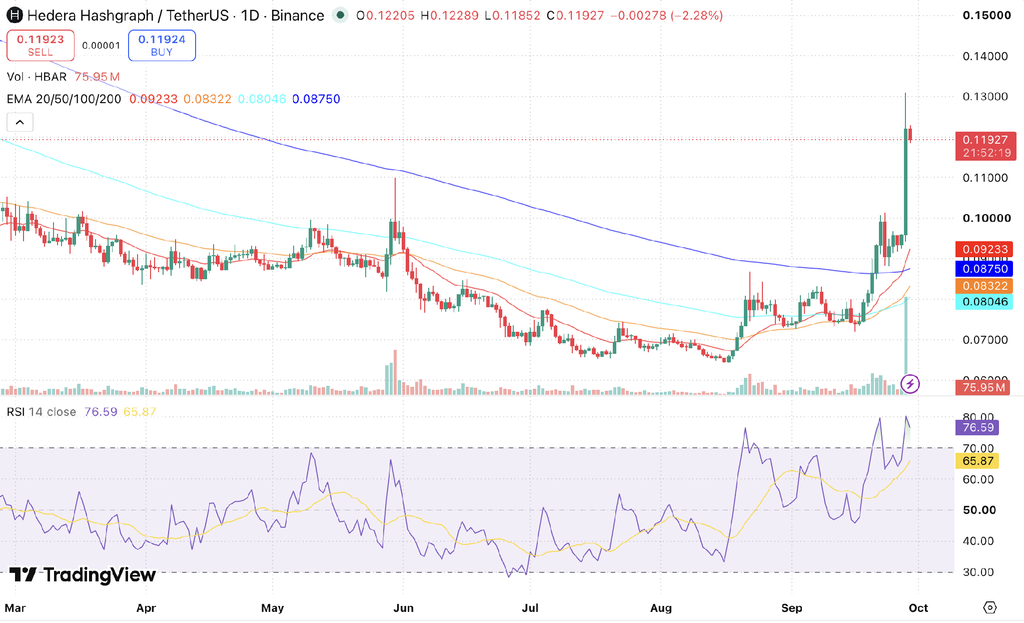
HBAR/USDT, Source: TradingView
Key Insights
- HBAR is pulling back from its $0.131 spike high, with buyers defending the $0.115 support zone and sellers capping the recovery near $0.123 this week.
- The October 2026 outlook remains moderately bullish as the 50-day EMA closes in on a golden cross with the 200-day, though HBAR is more likely to consolidate within the $0.105–$0.131 range before its next leg.
- Long-term forecasts for 2030 remain optimistic due to Hedera’s enterprise adoption and expanding ecosystem utility, potentially driving HBAR toward new cycle highs.
- Technically, RSI at 76.59 sits in overbought territory while all four EMAs trail below price, suggesting the trend is strong but due for a cooling phase.
HBAR Price Prediction – Today, This Week, October 2026
Here is the Hedera Crypto Price Prediction for today, this week, and October 2026.
| Timeframe | Price Target | Support | Resistance | ROI |
|---|---|---|---|---|
| Next 24 Hrs | $0.11800 | $0.11500 | $0.12300 | -1.1% |
| This Week | $0.11500 | $0.10800 | $0.12500 | -3.6% |
| October 2026 | $0.12000 | $0.10500 | $0.13100 | +0.6% |
Hedera Coin Price Prediction Today
Hedera is trading at $0.11927 and is expected to range between $0.11500 and $0.12300 in the next 24 hours. The RSI sits at 76.59, and price is 29.2% above the 20-EMA at $0.09233, signaling overbought short-term momentum. Today’s session low of $0.11852 is the first test; a hold above $0.11500 keeps the $0.11800 target in play, while a break below risks a drop to $0.11000.
Hedera Coin Price Prediction for This Week
Hedera is projected to trade between $0.10800 and $0.12500 for the week of 29 September – 5 October 2026. HBAR is 43.3% above the 50-day EMA at $0.08322, a gap that rarely holds without a pullback, and a bearish MACD crossover on the daily chart would be the first confirmation that the $0.131 spike has topped out for now. A weekly close above $0.12500 opens $0.13100; a loss of $0.10800 targets $0.10000.
Hedera Price Prediction for October 2026
Hedera’s October 2026 Price Prediction targets $0.12000, with a range of $0.10500–$0.13100. HBAR is 36.3% above its 200-day EMA at $0.08750, and the daily RSI at 76.59 signals overbought conditions. The 50-day EMA sits just $0.00428 below the 200-day and is on course for a golden cross in the first half of October. A monthly close above $0.13100 would confirm bullish momentum heading into November 2026.
Hedera Price Prediction for November 2026
By the end of November 2026, HBAR is projected at $0.12800, with support at $0.11000 and resistance at $0.14000. At that point, the focus should shift from the overbought RSI to trend structure. If price holds above $0.10500, the 100-day EMA could cross above the 200-day by early November, placing all four averages in bullish order for the first time since at least March. An RSI cooled to 60–65 would point to neutral-to-bullish conditions, and a monthly close above $0.14000 would bring the top of the December range near $0.15000 into play.
Hedera Price Prediction 2026 (Medium Term)
| Month | Price Target | Support | Resistance | ROI |
|---|---|---|---|---|
| Oct 2026 | $0.12000 | $0.10500 | $0.13100 | +0.6% |
| Nov 2026 | $0.12800 | $0.11000 | $0.14000 | +7.3% |
| Dec 2026 | $0.13500 | $0.11500 | $0.15000 | +13.2% |
Hedera’s 2026 price range is projected at $0.10500–$0.15000, driven by improving crypto market liquidity and increasing institutional participation. The $0.10500 level is the key bull/bear line for the rest of 2026; a hold above it targets $0.14000, while a break below risks a drop to the 20-day EMA near $0.09233, with the 200-day EMA at $0.08750 as the final line of defence for the uptrend. The daily RSI is overbought at 76.59, and the 50-day EMA is closing in on the 200-day, suggesting a strong trend that needs to cool before it can extend.
Hedera Price Prediction 2026 to 2040 (Long Term)
| Year | Price Target | Support | Resistance | ROI |
|---|---|---|---|---|
| 2027 | $0.14500 | $0.11800 | $0.16000 | +21.6% |
| 2028 | $0.18500 | $0.15000 | $0.21000 | +55.1% |
| 2029 | $0.24500 | $0.20000 | $0.28000 | +105.4% |
| 2030 | $0.32000 | $0.26000 | $0.38000 | +168.3% |
| 2031 | $0.28500 | $0.23000 | $0.34000 | +139.0% |
| 2035 | $0.62000 | $0.50000 | $0.75000 | +419.8% |
| 2040 | $1.25000 | $1.00000 | $1.50000 | +948.0% |
Read Also: How to buy Hedera (HBAR) in India
Where Will Hedera Price Go in 2030?
Hedera’s 2030 Price Prediction targets $0.32000, within a range of $0.26000–$0.38000, fueled by the post-2028 Bitcoin halving cycle and growing institutional adoption. With broader enterprise blockchain adoption expected by then, network utility and transaction demand could become major price drivers. Power Law and Metcalfe’s Law models support a range of $0.25000–$0.42000 under continued network growth. The Hedera Price Prediction 2030 remains bullish if HBAR sustains long-term adoption momentum and ecosystem expansion.
Where Will Hedera Price Go in 2031?
The Hedera Price Prediction for 2031 targets $0.28500, with a range of $0.23000–$0.34000, as the market enters the post-2028 Bitcoin halving digestion phase. Cycle analysis suggests 2031 may mirror the 2021 pattern, either consolidating from a 2030 peak or building a new accumulation base. LTH supply and exchange reserve trends will be the key on-chain signals to monitor.
Where Will Hedera Price Go in 2040?
By 2040, Hedera’s price is projected at $1.25000, ranging from $1.00000 to $1.50000, supported by long-term blockchain adoption, enterprise integrations, and expanding utility within the Hedera ecosystem. Metcalfe’s Law and Power Law models point to $0.90000–$1.60000 under moderate adoption; aggressive scenarios exceed $2.00000. The long-term Hedera price outlook remains optimistic, although these Hedera price forecasts carry high uncertainty and should be read as scenario ranges rather than fixed targets.
Hedera Technical Analysis
The following technical indicators were used to derive the Price Predictions above.
| Indicator | Value | Signal |
|---|---|---|
| Relative Strength Index (14-Day RSI) | 76.59 | Overbought |
| 20-Day EMA | $0.09233 | Bullish |
| 50-Day EMA | $0.08322 | Bullish, golden cross pending |
| 100-Day EMA | $0.08046 | Bullish |
| 200-Day EMA | $0.08750 | Bullish, price 36.3% above |
| Trading Volume (24H) | ~$800 million | Breakout confirmation |
Relative Strength Index (RSI)
The 14-day RSI is at 76.59, signaling overbought (above 70) conditions. RSI peaked near 81 during the 28 September breakout session and has already turned lower, while it holds 10.72 points above its signal line at 65.87. Readings above 70 reflect strong buying pressure but leave little room for further gains without a cooling phase, so sideways consolidation or a pullback is the more likely next step. A drop back below 70 with price holding above $0.11000 would reset momentum without damaging the trend.
Exponential Moving Averages (50-Day & 200-Day EMA)
HBAR is 43.3% above its 50-day EMA at $0.08322 and 36.3% above its 200-day EMA at $0.08750, its first sustained run above the 200-day since at least March. The 20-day EMA at $0.09233 has already crossed above the 200-day, and the 50-day sits only $0.00428 below it, on course for a golden cross in the first half of October if price holds above $0.10000. The 100-day at $0.08046 remains the last average meaningfully below the 200-day. This setup signals a trend reversal in progress, while the $0.10000–$0.10800 region is now key support for bullish continuation.
Volume Analysis
Hedera’s trading volume over the past 24 hours is approximately $800 million, more than double the $332.6 million recorded in late May. The 28 September breakout printed the largest daily volume bar on the chart since March, and the current session has already crossed 75.95 million HBAR within its first few hours. The move followed the listing of IDTrust, a Hedera-based identity platform, in the IBM Cloud Catalog and news of Hedera Council representation on NVIDIA’s Open Agent Safety Platform. Rising volume confirms bullish conviction behind the break above $0.10000, but volume needs to fade on pullbacks for the breakout to stay healthy; heavy selling volume below $0.11000 would signal distribution.
On-Chain Metrics (Bonus Indicator)
With HBAR trading above every daily close since March except the breakout session itself, the large majority of holders who bought over the past seven months are now estimated to be in profit, which raises the risk of profit-taking in the $0.12000–$0.13100 zone. Circulating supply stands near 43.83 billion HBAR, putting market capitalization at roughly $5.2 billion at current prices. The Fear & Greed Index reads 74 (Greed), a sharp turn from the Extreme Fear reading of late May, which supports the rally but historically warns of stretched positioning when paired with an overbought RSI.
Disclaimer: This article is for informational purposes only and does not constitute financial or investment advice. Crypto markets are highly volatile. Always do your own research (DYOR) before making any investment decisions.
FAQs
1. Can Hedera (HBAR) reach $1?
Yes, HBAR is projected to reach $1 by 2040, the low end of the $1.00–$1.50 range for that year. From $0.11927, $1 is an 8.4x move and implies a market capitalization near $43.8 billion at the current circulating supply of about 43.83 billion HBAR, against roughly $5.2 billion today. Getting there would need years of enterprise adoption and at least one full bull cycle.
2. How much will Hedera be worth in 2030?
Hedera is projected to be worth $0.32000 in 2030, within a range of $0.26000–$0.38000, a 168.3% return from $0.11927. The path assumes HBAR holds above its 200-day EMA at $0.08750 and that enterprise usage on the network keeps growing. Four years is a long horizon, so the figure is a scenario rather than a target.
3. Can HBAR return to its all-time high of $0.57?
Yes, HBAR is projected at $0.62000 in 2035, above its September 2021 all-time high of roughly $0.569. From $0.11927, a retest needs a 4.8x move, and the 2030 target of $0.32000 still sits about 44% below that high.
4. What is the Hedera price prediction for tomorrow?
HBAR is expected to trade near $0.11800 tomorrow, with support at $0.11500 and resistance at $0.12300, a 1.1% dip from $0.11927. The RSI at 76.59 is overbought after the spike to $0.131, so a short cooling phase is more likely than an immediate breakout. A daily close under $0.11500 would open a test of $0.11000.
5. What is the Hedera price prediction for 2027?
HBAR is projected to reach $0.14500 in 2027, within a range of $0.11800–$0.16000, a 21.6% return from $0.11927. The December 2026 target of $0.13500 is the intermediate step on that path. The outlook depends on HBAR holding its breakout above $0.10000 and on enterprise adoption continuing into 2027.
6. What is the Hedera price prediction for 2030 in INR?
HBAR is projected at about ₹30.53 in 2030, based on the $0.32000 target and a USD-INR rate near ₹95.4. The $0.26000–$0.38000 range translates to about ₹24.80 to ₹36.25. Those figures move with the exchange rate as well as the HBAR price.
7. What is the Hedera price prediction for 2040?
HBAR is expected to reach $1.25000 by 2040, within a range of $1.00000–$1.50000, a 948.0% return from $0.11927. Across 14 years that is compound growth of roughly 18% a year. A 2040 target spans several full market cycles, so it should be read as highly speculative.
8. How high will HBAR go in 2026?
HBAR could go as high as $0.15000 in 2026, with a December target of $0.13500 and support at $0.10500. After doubling from its August low near $0.064 to $0.131, HBAR needs to hold $0.10500 and clear $0.13100 to open the path toward $0.15000. Even at $0.15000, HBAR would still trade about 74% below its 2021 all-time high.
9. What will be HBAR price prediction 2026 in rupees?
HBAR is forecast to trade between ₹10.02 and ₹14.31 in 2026, based on the $0.10500–$0.15000 range and a USD-INR rate near ₹95.4. The December target for HBAR is $0.13500, or about ₹12.88. At the current $0.11927, HBAR is worth about ₹11.38.