This Harmony price analysis covers short-term and long-term ONE trends with daily, weekly, 2026, 2030, 2040, and 2050 forecasts. This crypto price prediction explores potential price targets, dynamic support and resistance levels, and momentum signals using technical indicators like the Relative Strength Index (RSI), exponential moving averages (EMAs), and volume trends. Track market direction, key breakout zones, and future scenarios based on current chart patterns and technical structure.
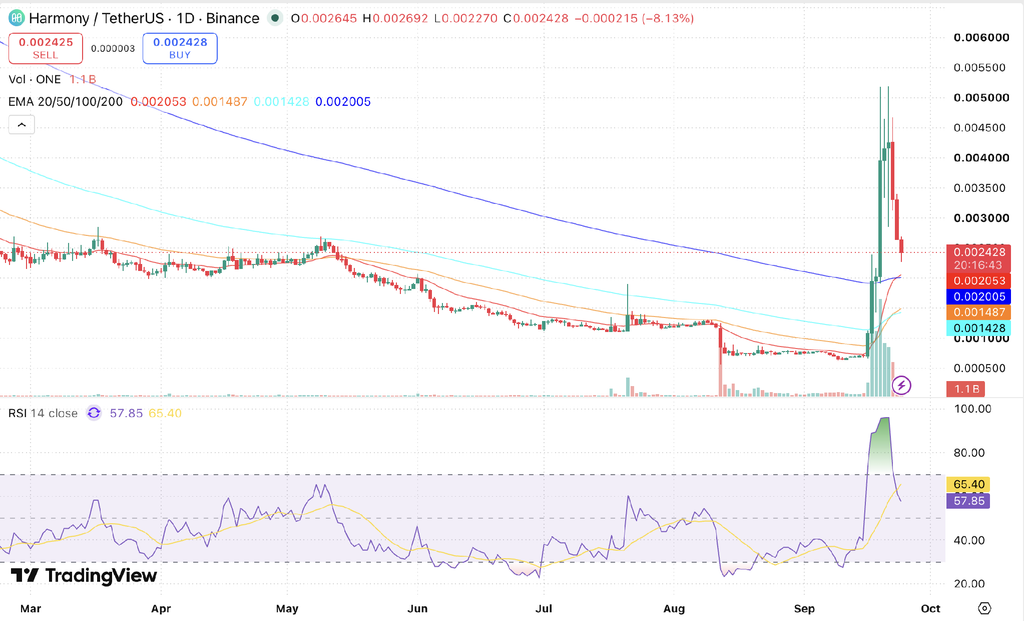
Harmony (ONE) is currently trading at $0.002428, reflecting cooling market sentiment as of September 24, 2026. The 14-day RSI stands at 57.85, sitting 7.55 points below its signal average at 65.40 after peaking above 95 during the previous week’s impulse, while the 50-day and 200-day EMAs are positioned at $0.001487 and $0.002005, respectively. The daily session opened at $0.002645 and dipped to an intraday low of $0.002270 before buyers intervened, and the 20-day EMA has climbed to $0.002053, leaving spot price 18.27% above it. Based on these technical indicators and broader market trends, ONE is expected to consolidate near $0.0022 to $0.0027 while defending structural support around $0.0020 before attempting its next directional expansion.
ONE/USDT, Source: TradingView
Key Insights
- ONE may trade between $0.0020 and $0.0030 this week after giving back more than half of its migration-driven rally, with the $0.0020 area, where the 20-day and 200-day EMAs meet, acting as the key floor.
- For September 2026, ONE targets $0.0024, with the recent session low of $0.002270 confirming that buyers are defending the liquidity band situated just above the $0.0020 moving average cluster.
- By 2026 and 2030, long-term movement will depend on market cycles and the Ethereum migration, and the 20-day EMA has just crossed above the 200-day for the first time since at least March, while the 50-day now sits above the 100-day.
- Current technical analysis: The RSI at 57.85 sits 7.55 points below its own average after peaking above 95, so momentum is cooling fast even though the reading is still above 50.
Trade ONE in INR on 
Deposit and withdraw in INR (₹).
No Conversion to Crypto Required.

Harmony Short-Term Price Prediction: Today, This Week, September 2026
Here is the Harmony (ONE) price prediction 2026 for today, this week, and September 2026.
| Timeframe | Price Target | Support | Resistance | ROI |
|---|---|---|---|---|
| Next 24 Hrs | $0.0024 | $0.0022 | $0.0027 | -1.15% |
| This Week | $0.0023 | $0.0020 | $0.0030 | -5.27% |
| September 2026 | $0.0024 | $0.0020 | $0.0033 | -1.15% |
Harmony Price Prediction Today
Based on technical analysis, Harmony is expected to reach $0.0024 in the next 24 hours. Immediate support sits at $0.0022, with overhead resistance at $0.0027. If $0.0022 fails to hold, secondary support lies at the key moving average confluence at $0.0020. The session opened at $0.002645 and printed a low of $0.002270, marking a corrective consolidation following the rejection near $0.0052.
Harmony (ONE) Price Prediction for This Week
ONE is projected at $0.0023 this week, with the range running from $0.0020 to $0.0030. A pullback of this size is typical after ONE rallied roughly six times in about a week, and the first real test sits at the 20-day EMA at $0.002053, now just above the 200-day at $0.002005. A daily close back above $0.0027 would show buyers absorbing the selling, while a close under $0.0020 would open the 50-day EMA near $0.0015.
ONE Price Prediction for September 2026
September should close near $0.0024, in a band of $0.0020 to $0.0033. ONE is 21.1% above the 200-day EMA at $0.002005 and 18.3% above the 20-day, and even after this week’s selling it still trades at more than three times its early-September level near $0.0007. The $0.0033 area, where the September 22 selloff closed, is the barrier that matters for the rest of the month. A close under $0.0020 would put the 50-day EMA back in play.
Harmony Price Prediction for October 2026
ONE is predicted to reach $0.0022 by the end of October 2026, in a range of $0.0016 to $0.0030. The primary fundamental driver remains the technical execution of the Ethereum ERC-20 token migration. Smooth custodial integrations and token distributions will determine whether speculative liquidity remains sticky. Defending the $0.0020 EMA cluster remains the critical prerequisite to open a retest of $0.0030.
Harmony Price Prediction 2026 (Medium Term)
| Month | Price Target | Support | Resistance | ROI |
|---|---|---|---|---|
| Sep 2026 | $0.0024 | $0.0020 | $0.0033 | -1.15% |
| Oct 2026 | $0.0022 | $0.0016 | $0.0030 | -9.39% |
| Nov 2026 | $0.0021 | $0.0015 | $0.0029 | -13.51% |
| Dec 2026 | $0.0023 | $0.0015 | $0.0032 | -5.27% |
Harmony’s 2026 price range is projected at $0.0015 to $0.0033, based on the current technical structure. The September breakout ended a four-month slide from the May high near $0.0026 to a low around $0.00065, but more than half of the rally has already been given back. Below spot, the 20-day EMA at $0.002053 and the 200-day at $0.002005 are the two levels that matter, and the 20-day now leads by just $0.000048. The RSI at 57.85 sits below its own average at 65.40 and is still falling, which usually means the pullback has further to run before a base form. A weekly close above $0.0030 would open the upper half of this range.
Harmony Price Prediction 2026 to 2050 (Long Term)
| Year | Price Target | Support | Resistance | ROI |
|---|---|---|---|---|
| 2027 | $0.0028 | $0.0020 | $0.0036 | +15.32% |
| 2028 | $0.0032 | $0.0023 | $0.0041 | +31.80% |
| 2029 | $0.0036 | $0.0026 | $0.0046 | +48.27% |
| 2030 | $0.0040 | $0.0029 | $0.0052 | +64.74% |
| 2031 | $0.0044 | $0.0032 | $0.0057 | +81.22% |
| 2035 | $0.0055 | $0.0040 | $0.0072 | +126.52% |
| 2040 | $0.0070 | $0.0050 | $0.0092 | +188.30% |
| 2050 | $0.0100 | $0.0070 | $0.0135 | +311.86% |
Harmony 2030 Forecast: What Is the Expected Price?
The 2030 target for ONE is $0.0040, in a range of $0.0029 to $0.0052. ONE trades above all four primary EMAs with the 20-day average holding above the 200-day line. Long-term valuation relies on successful execution of the Ethereum ERC-20 transition, ecosystem retention, and broader crypto market liquidity across multi-year cycles.
Harmony 2031 Outlook and Expected Price Range
The Harmony price prediction for 2031 targets $0.0044, with a range of $0.0032 to $0.0057, assuming ONE holds its reclaimed 200-day EMA and completes the ERC-20 migration with exchange support intact. The ONE price outlook remains dependent on sustained momentum, volume trends, and broader crypto market strength. The current setup, with price above every major average but the RSI at 57.85 below its own average, rests on structure more than momentum. Long-term projections remain highly uncertain because the chart only shows current technical indicators.
Harmony Price Prediction 2040 and 2050: Long-Term Forecast
By 2040, Harmony’s price is projected at $0.0070, ranging from $0.0050 to $0.0092, and by 2050 at $0.0100, ranging from $0.0070 to $0.0135, under a long-term adoption scenario. The current chart shows ONE trading 21.1% above its 200-day EMA at $0.002005, with all four EMAs below price, but this horizon depends far more on whether ONE finds lasting demand after the move to Ethereum and the shift toward AI video than on present technical structure. The Harmony price forecast for 2040 and 2050 is highly uncertain and should therefore be interpreted as a scenario range rather than a fixed target.
Harmony Technical Analysis
The following technical indicators were used to derive the price predictions above.
| Indicator | Value | Signal |
|---|---|---|
| Relative Strength Index (14-Day RSI) | 57.85 | Neutral, cooling from overbought |
| 20-Day EMA | $0.002053 | Bullish |
| 50-Day EMA | $0.001487 | Bullish |
| 100-Day EMA | $0.001428 | Bullish |
| 200-Day EMA | $0.002005 | Bullish, key support |
| Average Trading Volume (14-Day) | Elevated, easing | Pullback on lighter volume |
Relative Strength Index (RSI)
The 14-day RSI stands at 57.85, having retreated from extreme overbought readings above 95 to sit 7.55 points below its signal average at 65.40. Crossing below its signal line confirms that short-term momentum has decelerated. However, holding above the neutral 50 line indicates that the broader impulse remains structurally protected. Defending 50 keeps the macro recovery constructive, while a breakdown below 45 would point toward an extended mean reversion toward the 50-day EMA.
Exponential Moving Averages (50-Day and 200-Day EMA)
ONE trades 21.1% above its 200-day EMA at $0.002005 with all four EMAs below price. The 20-day EMA at $0.002053 has just crossed above the 200-day by $0.000048, and the 50-day at $0.001487 now sits $0.000059 above the 100-day at $0.001428. Before this month’s breakout all four averages were stacked in bearish order with the 200-day on top, so the shift is significant, but it is also young, and the 200-day has only just stopped falling. Price is 18.3% above the 20-day, so there is room for a pullback that does no structural damage. A daily close under $0.0020 would put both crossovers at risk and hand control back to sellers.
Volume Analysis
Harmony’s turnover exploded during the breakout, with the daily bars expanding to the largest on the chart as price ran from about $0.0007 to above $0.004. Volume on the three red candles since has been lighter than on the advance, which suggests the pullback so far is profit-taking rather than heavy distribution, although today’s session has already printed 1.1 billion ONE. The reading to watch is whether turnover keeps shrinking as price approaches $0.0020, because light volume into the EMA cluster would mark the dip as a pause rather than the start of a full retrace.
Disclaimer: This article is for informational purposes only and does not constitute financial or investment advice. Crypto markets are highly volatile. Always do your own research (DYOR) before making any investment decisions.
FAQs
1. What will Harmony be worth in 2026?
Harmony is projected to trade within a channel of $0.0015 to $0.0033 through the remainder of 2026, with an expected year-end target of $0.0023. ONE is currently consolidating near $0.0024 after retracing from its recent high near $0.0052. Defending the $0.0020 zone, where the 20-day and 200-day EMAs converge, is the primary requirement to keep the upper half of this range accessible.
2. What will be the price of 1 ONE in 2030?
This analysis projects 1 ONE at $0.0040 in 2030, within a range of $0.0029 to $0.0052, a 64.74% return from $0.002428. At a USD-INR rate near ₹95.4, that is about ₹0.38. The path assumes the ERC-20 migration completes smoothly and ONE holds above its 200-day EMA through the next market cycle.
3. Will the Harmony price ever hit $10?
No, reaching $10 is considered unrealistic under current tokenomics. A $10 price represents an advance of roughly 4,118x from $0.002428, implying a market capitalization of approximately $150 billion based on the circulating supply of ~15 billion ONE. Multi-decade baseline projections target $0.0100 by 2050, placing a $10 valuation far outside standard analytical models.
4. Is Harmony a safe investment?
No, Harmony carries speculative risk consistent with high-beta crypto assets. Following earlier network challenges, the project is transitioning its token architecture to Ethereum as an ERC-20 asset, making the technical execution of this migration and long-term ecosystem utility the primary variables to track. Investors should evaluate moving average support levels and apply strict risk management.
5. What will be the Harmony price in 2050?
This analysis projects ONE at $0.0100 by 2050, within a range of $0.0070 to $0.0135, a 311.86% return from $0.002428. Across 24 years, that is compound growth of roughly 6% a year. A 2050 target spans several full market cycles and depends on ONE staying relevant after the migration, so it should be read as highly speculative.