This guide provides a Cosmos crypto price prediction using technical indicators such as RSI, MACD, and moving averages. Explore ATOM price forecasts for today, this week, and the long term through 2040, along with key support and resistance levels, momentum analysis, and market outlook. Whether you are tracking short-term price action or evaluating future potential, this forecast offers a data-driven view of Cosmos’s expected performance.
Cosmos (ATOM) is currently trading near $1.3724, up 1.03% and roughly 9% above its late-July low, as per the latest TradingView chart. The 14-day RSI has recovered to about 44.7 from a deeply oversold reading below 20 and now sits almost 18 points above its moving average at 26.9, while the 20-day, 50-day, 100-day, and 200-day EMAs are positioned at $1.3766, $1.5169, $1.6640, and $1.9468, respectively. ATOM is pressing directly against the 20-day EMA at $1.3766, sitting just 0.31% beneath it, which makes that the first level the rally has to clear.
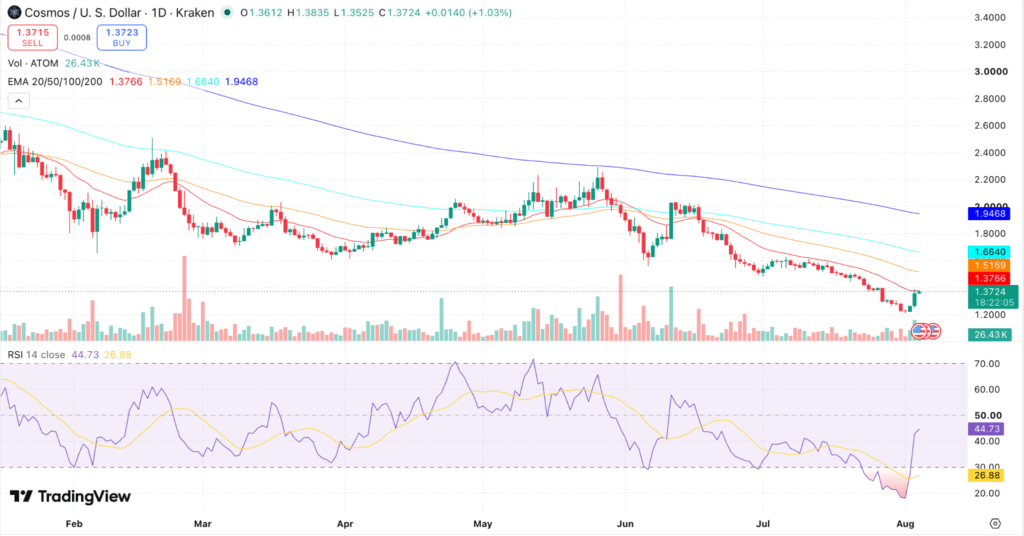
ATOM/USD daily chart, Source: TradingView
Key Insights
- Short-term outlook: ATOM has bounced about 9% off its late-July low and now sits within a third of a percent of the 20-day EMA at $1.3766. Clearing that level is the first requirement before the 50-day EMA at $1.5169 comes into view.
- Medium to long-term outlook: For the ATOM price prediction 2026, the 100-day EMA at $1.6640 is the level that would signal a genuine change of trend. The 200-day EMA at $1.9468 sits almost 30% above spot and marks how far the token has fallen through 2026.
- Technical analysis: RSI has rebounded from below 20, one of the most oversold readings on the chart this year, and the MACD has produced a bullish crossover. Both signals are forming beneath a falling EMA structure, so this reads as an oversold bounce rather than a confirmed reversal.
Trade ATOM in INR on 
Deposit and withdraw in INR (₹).
No Conversion to Crypto Required.

Cosmos Short-Term Price Prediction – Today, This Week, 2026
Here is the ATOM price prediction 2026 for today, this week, and 2026.
| Timeframe | Price Target | Support | Resistance | ROI |
|---|---|---|---|---|
| Next 24 Hrs | $1.400 | $1.320 | $1.450 | +2.01% |
| This Week | $1.450 | $1.320 | $1.517 | +5.65% |
| 2026 | $1.520 | $1.260 | $1.664 | +10.75% |
Read more: How to buy Cosmos in India
Cosmos Price Prediction Today
Cosmos is trading near $1.3724 after a 1.03% session that carried it to an intraday high of $1.3835. The 20-day EMA at $1.3766 is effectively at spot, so the next 24 hours come down to whether ATOM can close above it. Immediate support sits near $1.3200, while $1.3766 followed by the 50-day EMA at $1.5169 forms the resistance overhead.
Cosmos Coin Price Prediction for This Week
Cosmos is projected to trade between $1.3200 and $1.5169 this week. ATOM is below all four of its EMAs, so the first job is reclaiming the 20-day EMA at $1.3766 and turning it into support. A daily close above that level would improve Cosmos’s short-term price outlook and open the path toward the 50-day EMA at $1.5169. On the downside, a close under $1.3200 would suggest the oversold bounce has run its course and bring the $1.2600 low back into focus.
Cosmos Price Prediction for 2026
Cosmos’s 2026 price prediction targets $1.5200, with a range of $1.2600-$1.6640. The rally has come off an RSI reading below 20, which is the kind of extreme that usually produces a bounce, but ATOM still has to convert that into structure by holding above the 20-day EMA. A monthly close above the 50-day EMA at $1.5169 would be the first higher level ATOM has established since June. However, if the token loses $1.2600, the 2026 outlook turns defensive and the all-time low near $1.16 becomes the reference point beneath it.
Cosmos Coin Price Prediction for September 2026
Cosmos’s September 2026 price prediction targets $1.6600, with a range of $1.3800-$1.7500. If ATOM establishes the 20-day EMA as support and clears the 50-day EMA at $1.5169, buyers may attempt to push the price toward the 100-day EMA at $1.6640. A sustained move above $1.6640 would be the first real evidence that the downtrend running since May is breaking. However, if the token fails at the 50-day EMA again, September is more likely to be spent consolidating between $1.3200 and $1.5200.
Cosmos Price Prediction 2026 (Medium Term)
| Month | Price Target | Support | Resistance | ROI |
|---|---|---|---|---|
| Aug 2026 | $1.520 | $1.260 | $1.664 | +10.75% |
| Sep 2026 | $1.660 | $1.380 | $1.750 | +20.96% |
| Oct 2026 | $1.750 | $1.520 | $1.950 | +27.51% |
| Nov 2026 | $1.950 | $1.660 | $2.100 | +42.09% |
| Dec 2026 | $2.100 | $1.750 | $2.300 | +53.02% |
Cosmos’s 2026 price range is projected at $1.2600-$2.1000 based on the latest EMA structure. The 100-day EMA at $1.6640 is the level ATOM must reclaim to change the character of the chart, while the 200-day EMA at $1.9468 remains the major resistance to clear. For ATOM to confirm a stronger bullish reversal, it needs consecutive monthly closes above $1.6640. Until then, the Cosmos price prediction stays cautious, with the entire 2026 forecast resting on the late-July low continuing to hold.
Want to diversify beyond Cosmos? Check out the Top 10 Cryptos To Invest In 2026
Cosmos Price Prediction in INR (2026–2030)
For Indian traders, here is what the ATOM price targets translate to in rupees.
| Period | ATOM Target USD | ATOM Price INR est. |
|---|---|---|
| August 2026 | $1.520 | ₹145.01 |
| December 2026 | $2.100 | ₹200.34 |
| 2027 | $2.600 | ₹248.04 |
| 2030 | $5.500 | ₹524.70 |
INR estimates based on a USD/INR rate of ~₹95.4. Rate fluctuations will affect actual INR values; verify at time of trade.
Cosmos Long-Term Price Outlook (2027–2040)
The long-term outlook for ATOM rests on three structural questions: whether the Cosmos Hub can capture economic value from the IBC standard it created rather than only providing the plumbing, whether the proposed shift to variable inflation tied to real network fees is actually ratified, and whether the ecosystem stops contracting. The Hub’s own governance discussions through 2026 have been unusually candid that stack adoption alone has not translated into economic gravity for ATOM.
The following forecasts are derived from network-adoption models, governance and supply-schedule analysis, and historical ATOM volatility. They represent scenario ranges, not price targets. ATOM trades roughly 97% below its all-time high and only about 18% above its all-time low, so all long-term figures below should be read against a base that is already deeply impaired.
| Year | Price Target | Support | Resistance | ROI |
|---|---|---|---|---|
| 2027 | $2.60 | $1.90 | $3.40 | +89.45% |
| 2028 | $3.20 | $2.40 | $4.20 | +133.17% |
| 2029 | $4.20 | $3.00 | $5.50 | +206.03% |
| 2030 | $5.50 | $4.00 | $7.20 | +300.76% |
| 2031 | $6.40 | $4.60 | $8.50 | +366.34% |
| 2035 | $10.50 | $7.00 | $14.00 | +665.08% |
| 2040 | $16.00 | $11.00 | $22.00 | +1065.84% |
Where Will Cosmos Price Go in 2030?
Cosmos’s 2030 price prediction targets $5.50, within a range of $4.00-$7.20. The case rests on value capture rather than scarcity. ATOM has no fixed supply cap today, and while a proposal to set a maximum supply of 800 million ATOM has been debated in Cosmos Hub governance during 2026, it has not been enacted. What matters by 2030 is whether the Hub earns fee revenue proportional to the traffic moving across IBC, which connects well over a hundred independent chains. If it does, ATOM finally has a cash-flow argument; if it does not, the token stays a bet on infrastructure it does not monetise.
Where Will Cosmos Price Go in 2031?
The Cosmos price prediction for 2031 targets $6.40, with a range of $4.60-$8.50. By then the outcome of the tokenomics debate should be settled, whether that means variable inflation tied to network fees, lock-based staking multipliers, a hard supply cap, or none of them. The signals worth monitoring between now and then are the bonded ratio, Hub fee revenue, and whether the number of active chains building on the Cosmos SDK grows or continues to shrink. Ecosystem retention has been Cosmos’s central weakness through 2026.
Where Will Cosmos Price Go in 2040?
By 2040, Cosmos’s price is projected at $16.00, ranging from $11.00 to $22.00. Even at the top of that range, ATOM would sit at roughly half its all-time high, which is a realistic reflection of how much value the token has lost and how much sustained execution would be required to recover it. Forecasts over a 14-year horizon carry very high uncertainty and should be read as scenario ranges, not fixed targets.
Cosmos Technical Analysis
The following technical indicators were used to derive the Cosmos price prediction above.
| Indicator | Value | Signal |
|---|---|---|
| Relative Strength Index (14-Day RSI) | 44.73 | Recovering from oversold, still below 50 |
| RSI Moving Average | 26.88 | RSI nearly 18 points above its MA |
| 20-Day EMA | $1.3766 | Immediate resistance, price just below |
| 50-Day EMA | $1.5169 | Second resistance level |
| 100-Day EMA | $1.6640 | Key trend-change level |
| 200-Day EMA | $1.9468 | Long-term resistance, still falling |
| MACD | -0.0736 (signal -0.0810) | Bullish crossover, but still below zero |
| Trading Volume, session to date | 26.43K ATOM | Daily candle still open |
Relative Strength Index (RSI)
The 14-day RSI has recovered to about 44.7 after dipping below 20 in late July, which was the most oversold reading ATOM has printed all year. It now sits nearly 18 points above its own moving average at 26.9, and a gap that wide reflects a sharp snap-back off an extreme rather than a steady build in demand. Readings this stretched above the average typically cool off. A push through 50 and a hold above it would strengthen the Cosmos price prediction, while a fade back under 35 would suggest the oversold bounce has been sold into.
Moving Averages – 20-Day, 50-Day, 100-Day and 200-Day EMA
ATOM trades below all four EMAs, arranged in perfect bearish order at $1.3766, $1.5169, $1.6640, and $1.9468, with every one of them sloping down. That is the cleanest expression of a sustained downtrend, and a 9% bounce has not changed it. What makes the current setup interesting is proximity: price sits just 0.31% under the 20-day EMA, so the first test arrives immediately rather than after another leg higher. Beyond that, the token is 9.5% under the 50-day and 29.5% under the 200-day. The 100-day EMA at $1.6640 is the level that would actually matter, because reclaiming it would be the first higher structure ATOM has built since May.
MACD (Moving Average Convergence Divergence)
The daily MACD has produced a bullish crossover, with the MACD line at -0.0736 moving above its signal line at -0.0810 and the histogram turning positive at +0.0074. The qualifier is that both lines remain well below the zero line, so this is momentum improving inside a downtrend rather than momentum turning positive outright. A push of the MACD line toward zero would be a considerably stronger signal than the crossover itself. Until that happens, the setup is consistent with a counter-trend rally toward the 50-day EMA.
Volume Analysis
The current daily candle is still open, with roughly 26.43K ATOM traded so far, so it cannot yet be compared against a completed session. What the recent bars show is that the decline into the late-July low ran on thinning volume, and the bounce has produced a visible but not exceptional pickup in participation. For the Cosmos price prediction to turn constructive, a reclaim of $1.3766 and then $1.5169 needs volume expansion behind it. Without that, ATOM is more likely to keep oscillating between $1.2600 and $1.5200.
FAQs
Q1. What will 1 ATOM be worth in 2030?
Based on the models used in this forecast, ATOM is projected near $5.50 in 2030, within a range of $4.00 to $7.20. The outcome depends heavily on whether the Cosmos Hub starts capturing fee revenue from the IBC traffic it enables. Long-term forecasts for ATOM vary widely between analysts, so treat this as a scenario range rather than a fixed target.
Q2. Will Cosmos hit $10?
The long-term models used here place ATOM near $10.50 by 2035 and $16.00 by 2040, which puts $10 somewhere in the mid-2030s under the base case. Reaching it sooner would require the tokenomics overhaul to be ratified and the ecosystem to return to growth. It remains a long-term possibility rather than a near-term target.
Q3. What is Cosmos and what does ATOM do?
Cosmos is a network of independent, interoperable blockchains connected by the Inter-Blockchain Communication protocol, often described as the internet of blockchains. The Cosmos Hub is the central chain, and ATOM is its native token, used for staking, governance, and transaction fees. Developers build sovereign chains using the Cosmos SDK rather than deploying contracts onto a shared chain.
Q4. Will Cosmos go up?
Cosmos has bounced roughly 9% off an extremely oversold low, but it has not yet reclaimed a single moving average. Whether it goes up from here depends on clearing the 20-day EMA at $1.3766 and then the 50-day EMA at $1.5169. The broader trend is still down, so upside has to be built one resistance level at a time.
Q5. Why is Cosmos going down?
Cosmos has fallen because the IBC standard it pioneered is widely used while the Hub itself captures very little of the resulting economic value, and because ATOM has carried years of staking inflation without a matching demand source. Ecosystem contraction through 2026, with several projects winding down, has added to the pressure. The result is a token trading roughly 97% below its all-time high.
Q6. What is Cosmos’s all-time high?
Cosmos reached an all-time high of about $43.84 in 2021 and an all-time low of about $1.16. ATOM currently trades roughly 97% below that peak and around 18% above that low. Traders often compare Cosmos price predictions to both levels to frame the range of possible outcomes.
Q7. Is Cosmos dead?
No, but the ecosystem has been contracting rather than growing through 2026, and Cosmos Hub governance has acknowledged this directly. IBC remains live and widely used, the Cosmos SDK still underpins many app-chains, and active governance continues. The open question is economic value capture for ATOM, not whether the technology works.
Q8. How high will Cosmos go in 5 years?
By 2031, the forecasts in this article place ATOM near $6.40, within a range of $4.60 to $8.50. That assumes the tokenomics debate resolves in a way that reduces dilution and that Hub fee revenue grows. If the ecosystem keeps contracting, the lower end of that range is the more realistic outcome.
Q9. What is the Cosmos ATOM inflation rate?
ATOM has historically used a dynamic inflation model that adjusts with the share of supply staked, with the maximum rate capped at 10% following a governance vote in 2023. During 2026 the community debated moving to variable inflation tied to real network fees, adding lock-based staking multipliers, and capping total supply at 800 million ATOM. None of those changes has been enacted, so the existing model remains in force.
Q10. What will Cosmos be worth in 2040?
Long-term adoption models place ATOM near $16.00 by 2040, within a range of $11.00 to $22.00. These are high-uncertainty scenario ranges over a 14-year horizon and assume Cosmos remains relevant as interoperability infrastructure. Even at the top of the range, ATOM would sit at roughly half its all-time high.
Q11. Will Cosmos reach $50?
ATOM reaching $50 sits far outside the base case used in this forecast, which places the 2040 ceiling near $22.00. A move of that size would require ATOM to exceed its all-time high, which in turn would need the Hub to become a major fee-generating chain rather than a routing layer. It should not be treated as a planning assumption.
Q12. What is the Cosmos price prediction for 2026 in INR?
At a December 2026 target of $2.10 and a USD/INR rate of approximately ₹95.4, ATOM could trade near ₹200.3 by year-end 2026. Indian traders can buy ATOM directly on CoinDCX in INR without any USD conversion.
Q13. Is Cosmos a good investment in 2026?
Whether Cosmos is a good investment in 2026 depends on how you weigh genuine technical infrastructure against years of the Hub failing to capture value from it. The base case in this forecast puts ATOM between $1.26 and $2.10 for the rest of the year, with meaningful upside requiring a clean break above the 100-day EMA at $1.6640. This is a high-risk position trading near multi-year lows and should be sized accordingly.
Q14. Where can I buy Cosmos in India?
Indian traders can buy ATOM directly on CoinDCX in INR, with no USD conversion, no international brokerage, and no currency risk from exchange rate fluctuation. ATOM is available for spot purchase and as a trading pair on India’s FIU-IND registered digital asset exchange.
Q15. Will Cosmos recover?
Recovery toward the 100-day EMA at $1.6640 is a reasonable medium-term scenario if the late-July low holds and the tokenomics debate resolves constructively. Recovery to the all-time high would require roughly a 32x move and is not a realistic near-term assumption. The immediate question is whether ATOM can hold above $1.2600 and reclaim its short-term moving averages.
Q16. Will Cosmos go back down?
Cosmos could go back down if it fails at the 20-day EMA near $1.3766 and loses the $1.3200 support beneath it. A break under the late-July low near $1.2600 would put the all-time low around $1.16 into focus. However, if buyers defend $1.3200 and push ATOM above the 50-day EMA at $1.5169, the price could attempt a run at the 100-day EMA.
Disclaimer
This article is for informational purposes only and does not constitute financial or investment advice. Digital asset markets are highly volatile and prices can change rapidly. Past performance is not indicative of future results. The price predictions above are based on technical and on-chain analysis and should not be construed as investment recommendations. Always conduct your own research before making any trading or investment decisions.