

This Algorand price analysis covers short-term and long-term ALGO trends with daily, weekly, 2026, 2030, and 2031 forecasts. This crypto price prediction explores potential price targets, dynamic support and resistance levels, and momentum signals using technical indicators like the Relative Strength Index (RSI), exponential moving averages (EMAs), and volume trends. Track market direction, key breakout zones, and future scenarios based on current chart patterns and technical structure.
Algorand (ALGO) is projected to reach $0.148 by the end of October 2026, up from $0.1344 on September 29, 2026, if it can close above resistance at $0.140. A 13% breakout on September 28, backed by the heaviest volume since March, lifted price above all four daily EMAs, with the 20-day at $0.1103 now above the 200-day at $0.1022. With the RSI overbought at 75.58, ALGO is expected to consolidate between $0.130 and $0.140 before its next leg.
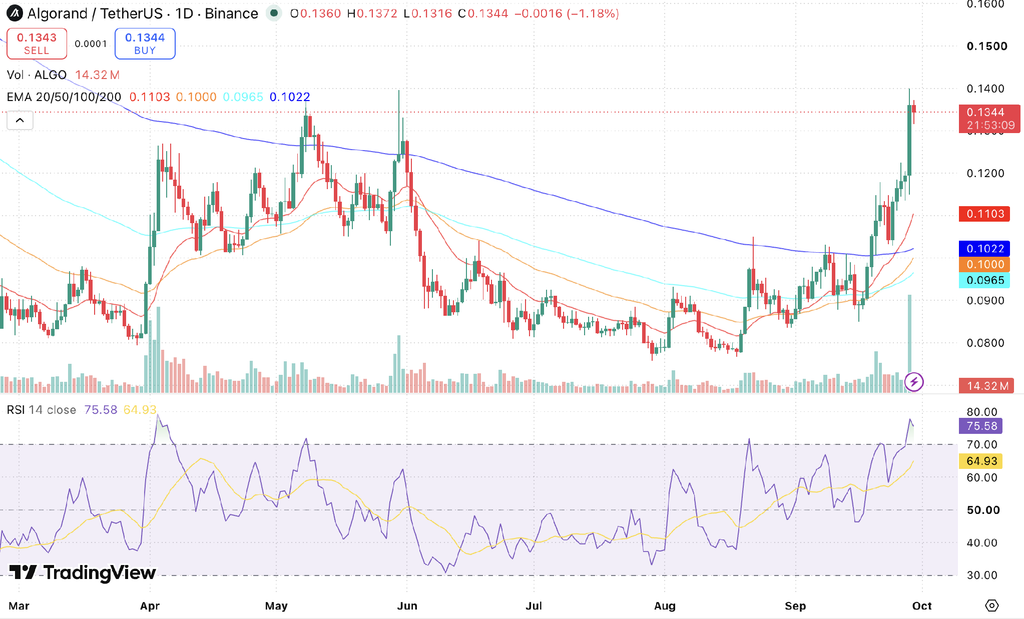
ALGO/USDT, Source: TradingView
Key Insights
- ALGO is trading between $0.120 and $0.150 this week, with $0.140 the barrier to clear and the $0.120 breakout base the level that has to hold on a pullback.
- For October 2026, ALGO targets $0.148, with a likely golden cross between the 50-day and 200-day EMAs adding support if price stays above $0.120.
- By 2026 and 2030, long-term movement will depend on market cycles, and the 20-day EMA at $0.1103 now sits $0.0081 above the 200-day, while the 50-day is only $0.0022 below it.
- Current technical analysis: The RSI at 75.58 is 10.65 points above its own average at 64.93, so momentum is strong but stretched, and a cooling phase would be normal after a 13% daily move.
Algorand Short-Term Price Prediction: Today, This Week, October 2026
Here is the ALGO coin price prediction 2026 for today, this week, and October 2026.
| Timeframe | Price Target | Support | Resistance | ROI |
|---|---|---|---|---|
| Next 24 Hrs | $0.1360 | $0.1300 | $0.1400 | +1.19% |
| This Week | $0.1420 | $0.1200 | $0.1500 | +5.65% |
| October 2026 | $0.1480 | $0.1200 | $0.1600 | +10.12% |
Algorand Price Prediction Today
Based on the technical analysis, Algorand will reach $0.1360 in the next 24 hours. Immediate horizontal support sits at $0.1300, with overhead resistance marked at $0.1400. If $0.1300 fails to hold, secondary support lies at $0.1200. The intraday session low of $0.1316 has already held as the initial demand shelf, while the session peak of $0.1372 defines near-term resistance, just under the $0.140 high set on September 28.
Algorand Price Prediction for This Week
ALGO is projected at $0.1420 this week, with the range running from $0.1200 to $0.1500. The 20-day EMA at $0.1103 is rising steeply and provides dynamic trendline support beneath the $0.120 breakout base. A confirmed daily close above $0.140 would clear the late-May and September highs and unlock a move toward the $0.145 to $0.150 zone.
Algorand Price Prediction for October 2026
ALGO is predicted to reach $0.1480 by the end of October 2026, in a range of $0.1200 to $0.1600. The barrier is $0.140, which the price in late May and again on September 28, so October turns on whether ALGO can close above it. The 50-day EMA at $0.1000 is rising faster than the 200-day at $0.1022, so a golden cross looks likely early in the month if price holds above $0.120. First ALGO needs to hold $0.130 and then the $0.120 breakout base. A monthly close above $0.160 would put $0.180 in view.
Algorand Price Prediction for November 2026
Algorand’s price target for November 2026 is $0.1550, a 15.33% gain from current levels, with a projected range of $0.1250 to $0.1700. The target assumes ALGO secures a close above $0.140 in October, turning that former ceiling into support with $0.150 the next level to clear. By then, the rising 20-day EMA is likely to have closed much of its current 21.8% gap to price, giving the rally a firmer base. If October fails at $0.140, November is more likely to hold inside a $0.125 to $0.140 range while the averages catch up.
Read Also: How to buy Algorand in India
ALGO Price Prediction 2026 (Medium Term)
| Month | Price Target | Support | Resistance | ROI |
|---|---|---|---|---|
| Sep 2026 | $0.1350 | $0.1300 | $0.1400 | +0.45% |
| Oct 2026 | $0.1480 | $0.1200 | $0.1600 | +10.12% |
| Nov 2026 | $0.1550 | $0.1250 | $0.1700 | +15.33% |
| Dec 2026 | $0.1600 | $0.1300 | $0.1800 | +19.05% |
Algorand’s 2026 price range is projected at $0.1200 to $0.1800, based on the current technical structure. The September 28 close at $0.1360 is the highest daily close on the chart since March, and it has taken ALGO back into the $0.137 to $0.140 zone that capped the May and late-May rallies. Below spot, the 20-day EMA at $0.1103 and the 200-day at $0.1022 are the two levels that matter, and the gap between them now stands at $0.0081 after the 20-day crossed above. The 50-day and 100-day EMAs still sit below the 200-day, so the averages remain two crossovers away from full bullish order, with the 50-day the closer of the two. A weekly close above $0.140 would open the upper half of this range.
Algorand Price Prediction 2026 to 2031 (Long Term)
| Year | Price Target | Support | Resistance | ROI |
|---|---|---|---|---|
| 2027 | $0.18 | $0.12 | $0.25 | +33.93% |
| 2028 | $0.28 | $0.18 | $0.40 | +108.33% |
| 2029 | $0.40 | $0.25 | $0.60 | +197.62% |
| 2030 | $0.60 | $0.35 | $0.90 | +346.43% |
| 2031 | $0.85 | $0.50 | $1.20 | +532.44% |
Algorand 2030 Forecast: What Is the Expected Price?
The 2030 target for Algorand is $0.60, within an estimated range of $0.35 to $0.90. Spot price trades above all four EMAs, and the 20-day crossing above the 200-day is the first long-term trend signal of this advance. Long-term valuation relies on network adoption, staking participation, and the growth of real-world applications built on Algorand’s pure proof-of-stake blockchain.
Algorand 2031 Outlook and Expected Price Range
The Algorand price prediction for 2031 targets $0.85, with a range of $0.50 to $1.20, assuming ALGO holds its reclaimed 200-day EMA and builds on the structure established in September. The ALGO price outlook remains dependent on sustained momentum, volume trends, and broader crypto market strength. The current setup, with price above every major average and the RSI at 75.58 in overbought territory, rests on momentum more than on settled structure. Long-term projections remain highly uncertain because the supplied chart only shows current technical indicators.
Algorand Coin Price in INR
The figures below convert the current ALGO price of $0.1344 at a USD-INR rate of about ₹95.9.
| ALGO Amount | Price in INR (Approx) |
|---|---|
| 1 ALGO | ₹12.89 |
| 5 ALGO | ₹64.44 |
| 10 ALGO | ₹128.89 |
| 25 ALGO | ₹322.22 |
| 50 ALGO | ₹644.45 |
| 100 ALGO | ₹1,288.90 |
Algorand Technical Analysis
The following technical indicators were used to derive the price predictions above.
| Indicator | Value | Signal |
|---|---|---|
| Relative Strength Index (14-Day RSI) | 75.58 | Overbought, strong momentum |
| 20-Day EMA | $0.1103 | Bullish |
| 50-Day EMA | $0.1000 | Bullish |
| 100-Day EMA | $0.0965 | Bullish |
| 200-Day EMA | $0.1022 | Bullish |
| Breakout Volume (Sep 28) | Highest since March | Breakout confirmed |
Relative Strength Index (RSI)
The 14-day RSI stands at 75.58, 10.65 points above its signal moving average at 64.93 and at its highest reading since early April. The oscillator has eased from a peak near 78 on September 28 as the current session pulled back from $0.1372, the first sign of momentum cooling. Readings such as RSI and MACD often stay stretched through strong breakouts, so an overbought print on its own is not a sell signal. A drop back below 70 alongside a close under $0.130 would point to a deeper pullback, while holding above 70 keeps the breakout intact.
Exponential Moving Averages (50-Day and 200-Day EMA)
ALGO trades 31.5% above its 200-day EMA at $0.1022 with all four EMAs below price. The headline development is the 20-day at $0.1103 crossing above the 200-day, which confirms the trend shift that began when price reclaimed the 200-day in the second half of September. The 50-day EMA at $0.1000 sits just $0.0022 below the 200-day and is rising faster, so a 50/200 golden cross is the next signal to watch. The 100-day at $0.0965 slipped below the 50-day earlier this month and is now the lowest of the four. Price is 21.8% above the 20-day, so a pullback toward the average would not damage the trend. Only a daily close under $0.1022 would put the longer-term recovery back in question.
Volume Analysis
Turnover expanded sharply on September 28, with the breakout candle printing the highest daily volume bar on the chart since March, well above the late-May spike. Rising volume on a push to multi-month highs points to active accumulation rather than a thin, speculative move. The current session’s 14.32 million ALGO is only a few hours old, so the real test is whether volume stays elevated if price attacks $0.140 again. A retest on fading volume would raise the odds of a range between $0.120 and $0.140.
Disclaimer: This article is for informational purposes only and does not constitute financial or investment advice. Crypto markets are highly volatile. Always do your own research (DYOR) before making any investment decisions.