

Hedera (HBAR) is currently trading at $0.09191, reflecting a bullish market sentiment as of 29 May 2026. The 14-day RSI stands at 48.91, signaling neutral conditions, while the 50-day and 200-day moving averages are positioned at $0.09221 and $0.09228, respectively. The MACD is slightly positive, indicating bullish short-term momentum. Based on these technical indicators and broader market trends, HBAR is expected to test resistance near $0.09350 while maintaining support around $0.09100 in the near term.
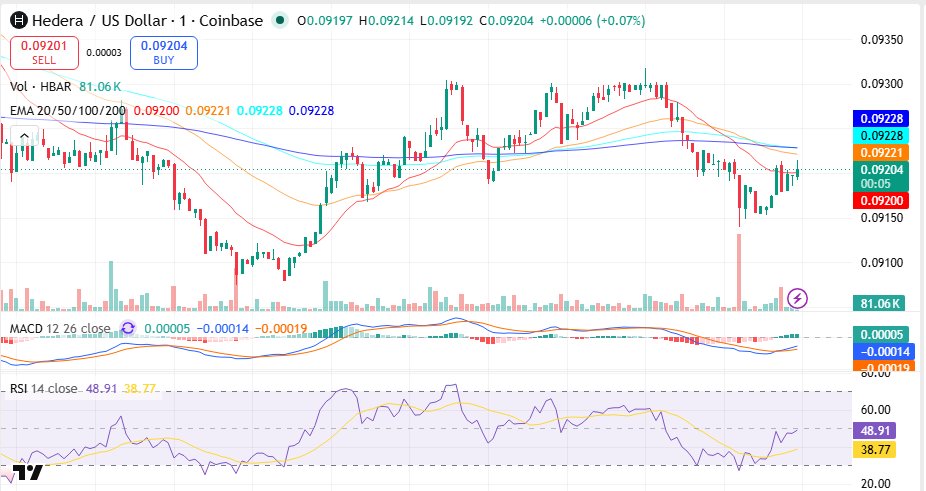
Source TradingView
Key Insights
● HBAR remains stable above the $0.091 support zone, with buyers attempting to reclaim the $0.093 resistance level during the current week.
● June 2026 outlook remains moderately bullish as improving sentiment and rising volume could push HBAR toward the $0.096–$0.100 range.
● Long-term forecasts for 2030 remain optimistic due to Hedera’s enterprise adoption and expanding ecosystem utility, potentially driving HBAR toward new cycle highs.
● Technically, RSI remains neutral while MACD shows early bullish crossover signs, suggesting short-term recovery momentum is building.
HBAR Price Prediction – Today, This Week, June 2026
Here is the Hedera Crypto Price Prediction for today, this week, and June 2026.
| Timeframe | Price Target | Support | Resistance | ROI |
| Next 24 Hrs | $0.09320 | $0.09100 | $0.09350 | +1.4% |
| This Week | $0.09500 | $0.09050 | $0.09600 | +3.5% |
| June 2026 | $0.09800 | $0.08800 | $0.10000 | +6.6% |
Hedera Coin Price Prediction Today
Hedera is trading at $0.09191 and is expected to range between $0.09100 and $0.09350 in the next 24 hours. The RSI sits at 48.91, and the 20-EMA at $0.09200 signals neutral-to-bullish short-term momentum. A hold above $0.09100 targets $0.09320; a break below risks a drop to $0.08980.
Hedera Coin Price Prediction for This Week
Hedera is projected to trade between $0.09050 and $0.09600 for the week of 29 May – 4 June 2026. HBAR is slightly below the 50-day EMA at $0.09221, with the MACD histogram contracting, pointing to recovering bullish momentum. A weekly close above $0.09600 opens $0.09850; a loss of $0.09050 targets $0.08800.
Hedera Price Prediction for June 2026
Hedera’s June 2026 Price Prediction targets $0.09800, with a range of $0.08800–$0.10000. HBAR is slightly below its 200-day MA at $0.09228, and the monthly RSI at 49 signals neutral conditions. A monthly close above $0.10000 would confirm bullish momentum heading into Q3 2026.
Hedera Price Prediction for July 2026
Hedera’s July 2026 Price Prediction targets $0.10200, with a range of $0.09400–$0.10500. HBAR is slightly above its 200-day MA at $0.09228, and the monthly RSI at 52 signals neutral-to-bullish conditions. A monthly close above $0.10500 would confirm bullish momentum heading into Q3 2026.
Hedera Price Prediction 2026 (Medium Term)
| Month | Price Target | Support | Resistance | ROI |
| June 2026 | $0.09800 | $0.08800 | $0.10000 | +6.6% |
| July 2026 | $0.10200 | $0.09400 | $0.10500 | +10.9% |
| Aug 2026 | $0.10800 | $0.09800 | $0.11200 | +17.5% |
| Sep 2026 | $0.11100 | $0.10100 | $0.11500 | +20.7% |
| Oct 2026 | $0.11600 | $0.10500 | $0.12000 | +26.2% |
| Nov 2026 | $0.12100 | $0.11000 | $0.12500 | +31.6% |
| Dec 2026 | $0.12800 | $0.11500 | $0.13200 | +39.2% |
Hedera’s 2026 price range is projected at $0.08800–$0.13200, driven by improving crypto market liquidity and increasing institutional participation. The 200-day MA at $0.09228 is the key bull/bear line — a hold above targets $0.12000, while a break below $0.08800 risks a drop to $0.08000. Weekly MACD is positive, and RSI is trending near the midline, suggesting balanced but improving momentum.
Hedera Price Prediction 2026 to 2040 (Long Term)
| Year | Price Target | Support | Resistance | ROI |
| 2027 | $0.14500 | $0.11800 | $0.16000 | +57.7% |
| 2028 | $0.18500 | $0.15000 | $0.21000 | +101.3% |
| 2029 | $0.24500 | $0.20000 | $0.28000 | +166.5% |
| 2030 | $0.32000 | $0.26000 | $0.38000 | +247.8% |
| 2031 | $0.28500 | $0.23000 | $0.34000 | +209.6% |
| 2035 | $0.62000 | $0.50000 | $0.75000 | +573.4% |
| 2040 | $1.25000 | $1.00000 | $1.50000 | +1,258.7% |
Read also: How to buy Hedera (HBAR) in India
Where Will Hedera Price Go in 2030?
Hedera’s 2030 Price Prediction targets $0.32000, within a range of $0.26000–$0.38000, fueled by the 2028 halving supply shock and growing institutional adoption. With broader enterprise blockchain adoption expected by then, scarcity and network utility could become major price drivers. Stock-to-Flow and Power Law models support a range of $0.25000–$0.42000 under continued network growth. The Hedera Price Prediction 2030 remains bullish if HBAR sustains long-term adoption momentum and ecosystem expansion.
Where Will Hedera Price Go in 2031?
The Hedera Price Prediction for 2031 targets $0.28500, with a range of $0.23000–$0.34000, as the market enters the post-2028 halving digestion phase. Cycle analysis suggests 2031 may mirror the 2021 pattern — either consolidating from a 2030 peak or building a new accumulation base. LTH supply and exchange reserve trends will be the key on-chain signals to monitor.
Where Will Hedera Price Go in 2040?
By 2040, Hedera’s price is projected at $1.25000, ranging from $1.00000 to $1.50000, supported by long-term blockchain adoption, enterprise integrations, and expanding utility within the Hedera ecosystem. Metcalfe’s Law and Power Law models point to $0.90000–$1.60000 under moderate adoption; aggressive scenarios exceed $2.00000. The long-term Hedera price outlook remains optimistic, although these Hedera price forecasts carry high uncertainty and should be read as scenario ranges rather than fixed targets.
Hedera Technical Analysis
The following technical indicators were used to derive the Price Predictions above. Each indicator’s value and signal should be updated at the time of publishing.
Relative Strength Index (RSI)
The 14-day RSI is at 48.91, signaling neutral (30–70) conditions. RSI in the 40–60 zone reflects market indecision, meaning the next catalyst will likely determine direction. Momentum is stabilizing after recent selling pressure, suggesting a potential recovery attempt if buying volume improves.
Moving Averages (50-Day & 200-Day MA)
HBAR is slightly below its 50-day MA at $0.09221 and slightly below its 200-day MA at $0.09228. This setup signals a short-term recovery attempt within a broader consolidation phase, while the $0.09228 region remains key resistance for bullish continuation.
MACD (Moving Average Convergence Divergence)
The MACD is above the signal line with a histogram of 0.00005, indicating bullish momentum. The histogram is beginning to expand in positive territory, supporting short-term upside potential if buyers maintain momentum above immediate support levels.
Volume Analysis
Hedera’s average daily trading volume over the past 24 hours is approximately $332.6 million. Rising volume confirms improving bullish conviction and supports the recent rebound from the $0.090 support zone. Strong spot market participation remains a positive signal for short-term trend continuation.
On-Chain Metrics (Bonus Indicator)
Approximately 68% of Hedera supply is currently estimated to be in profit, with the 30-day realized price near $0.08900. LTH supply is increasing, signaling ongoing accumulation from long-term holders. The Fear & Greed Index currently reads 22 (Extreme Fear), which slightly contradicts the improving technical setup but historically supports rebound opportunities during oversold sentiment phases.
Disclaimer: This article is for informational purposes only and does not constitute financial or investment advice. Crypto markets are highly volatile. Always do your own research (DYOR) before making any investment decisions.


