


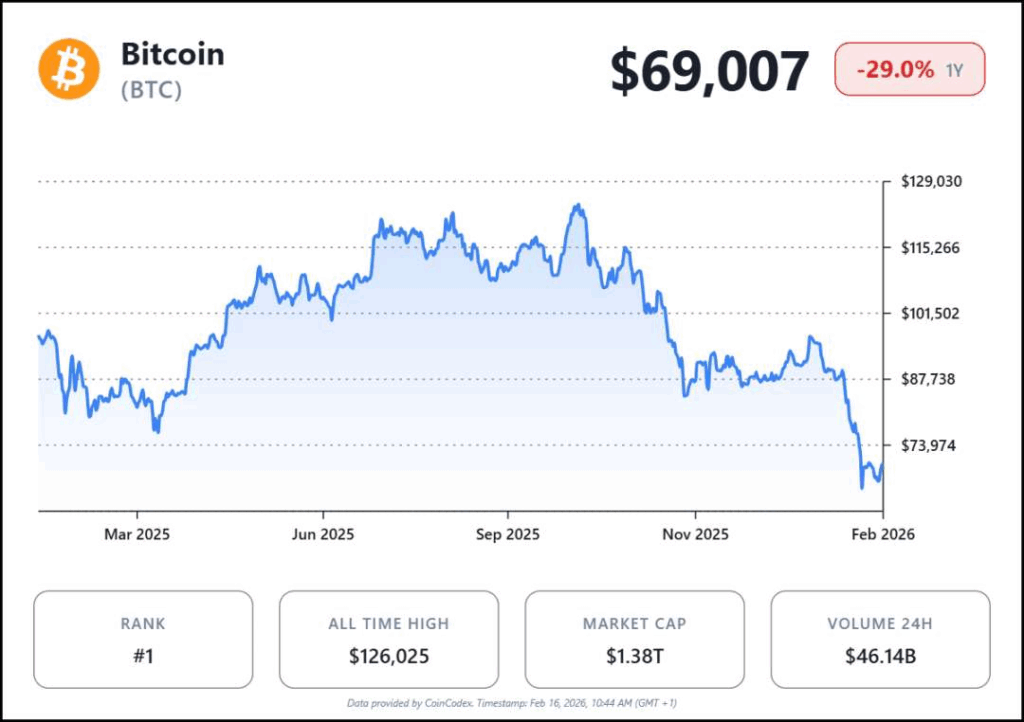
The Bitcoin price is enduring its weakest start to a year since 2018. As of February 17, 2026, Bitcoin (BTC) trades near $68,382.07, down roughly 24% year-to-date from its January opening around $90,062. The decline has coincided with broader risk-off sentiment across global markets, as bond yields remain elevated and liquidity conditions tighten. Spot Bitcoin ETF flows have also moderated compared to late 2025 levels.
Bitcoin Q1 Snapshot:
- January: −10%
- February (so far): −13%
- YTD decline: ~24%
- Current price: ~$68,000
This year, January closed with a loss of just over 10%, and February is tracking down more than 13% so far. If March fails to deliver a meaningful rebound, Q1 2026 will stand as the sharpest first-quarter drawdown in eight years.
Back-to-Back Red Months Signal Unusual Weakness
Looking at the data of Bitcoin monthly returns, it can be seen that back-to-back red months in the very beginning of the year are an extraordinary occurrence. Historically, such scenarios took place during significant bear market phases, including 2018 and 2022. This comparison has understandably unsettled market participants..
On the contrary, the character of this fall is not the same as in the previous crashes. The recent drop has been likened to a clean deleveraging. The open interest in futures has dropped by more than 20%; thus, it can be interpreted as the reduction of excessive leverage rather than the panic caused by forced liquidations.
Meanwhile, the strength of momentum indicators shows a drop in strength on higher timeframes. Both three and six-month graphs show convergence, and RSI levels indicate that the upward trend has lost its strength as compared to earlier cycles. This set of factors is the main reason the market players are generally cautious.
Source: CoinCodex
Bitcoin $60K–$65K Support Becomes the Key Level
The range of $60,000–$65,000 is currently the major support zone for Bitcoin. It is the zone where BTC price last consolidated during the previous rally. It has stopped being a resistance and has started to be a support.
If the price makes a clear breakdown below this zone, it will most probably lead to a situation where sellers will have more power, and the $55,000 level can be easily reached. On the contrary, if the price keeps above it then the market players will be more confident that the present decline is still within the limits of normal fluctuation.
Read more: Bitcoin Price Prediction
Sentiment data adds context. The Crypto Fear & Greed Index currently reflects “Extreme Fear,” with a reading near 8. Such levels show that confidence is fragile. Historically, extreme fear often appears near market lows, but it can persist during prolonged corrections.
Liquidity conditions also reflect restraint. Spot demand has cooled, and derivatives positioning shows reduced speculative activity. The absence of aggressive leverage reduces volatility but also limits sharp rebounds. On-chain data shows exchange balances remain relatively stable, suggesting the correction reflects reduced leverage rather than large-scale panic selling by long-term holders.
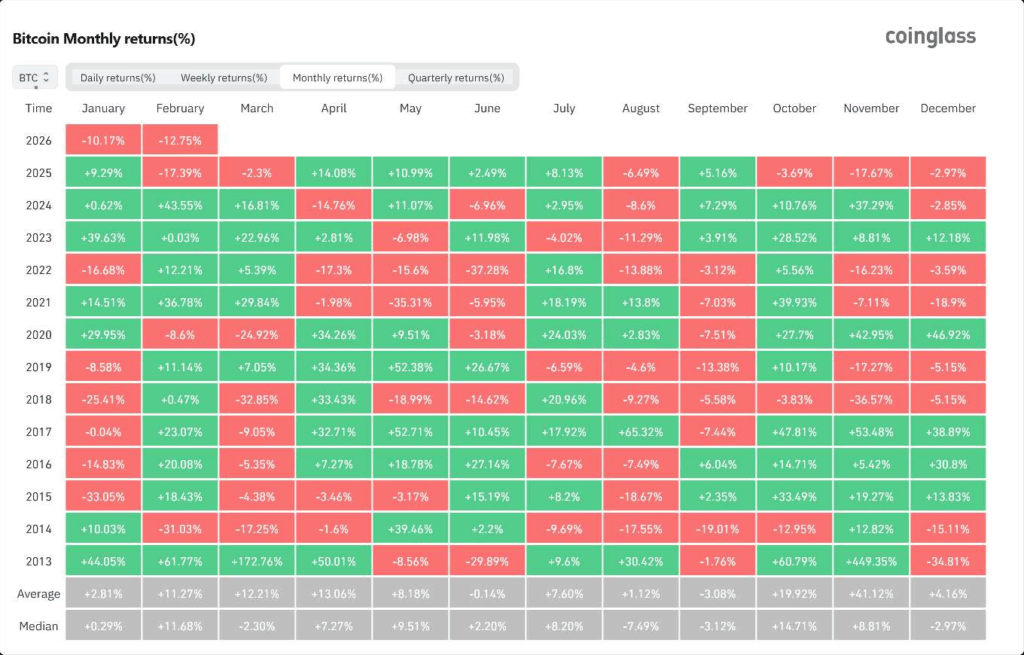
Source: Coinglass
Cycle Debate Resurfaces as Q1 Nears Close
The broader discussion now centers on the four-year cycle framework. Bitcoin’s historical pattern of halving-driven expansion and contraction has shaped investor expectations for over a decade. A red quarterly candle at this stage challenges that narrative. While the drawdown is significant, it remains milder than the 49% Q1 collapse seen in 2018. Whether this evolves into a full crypto bear market depends on how Bitcoin responds to the $60,000 support zone.
Still, a weak Q1 does not automatically define the year. In 2025, Bitcoin also posted a negative first quarter before later setting a new all-time high near $126,000. That precedent tempers some of the current market pessimism. What stands out today is the moderation in downside momentum compared to prior bear markets. The correction lacks the disorder and forced selling seen in 2018. Institutional participation remains visible, though more selective.
The next decisive signal will come from how March closes. A stabilization would ease pressure on the quarterly structure. Continued losses would confirm that 2026 has begun with the weakest Q1 performance in nearly a decade.
Conclusion
Bitcoin’s first quarter of 2026 is shaping up as its most difficult in eight years. With January and February already in the red, attention is fixed on whether the market can defend the $60,000–$65,000 support zone. While sentiment is deeply cautious, the correction so far reflects measured deleveraging rather than systemic breakdown. Investors will closely monitor ETF flows, macro liquidity signals, and the $60,000 level as Q1 approaches its close.


