


Bitcoin and Ethereum spot ETFs have recorded sustained outflows throughout February 2026, marking one of the most persistent capital withdrawal phases since the 2022 cycle. While previous reports highlighted single-day redemptions, cumulative February data now shows a broader trend of institutional repositioning rather than isolated volatility
The key question now is not just about red numbers, it is about liquidity absorption, ETF participation, and whether BTC and ETH can defend key support levels under institutional pressure.
Bitcoin ETF Flows, February 2026 Performance
From the data shared:
- Feb 5: –$434.1M
- Feb 11: –$276.3M
- Feb 12: –$410.2M
- Feb 19: –$165.8M
- Feb 23: –$203.8M
Several positive days (Feb 6, 10, 20) failed to offset persistent selling pressure.
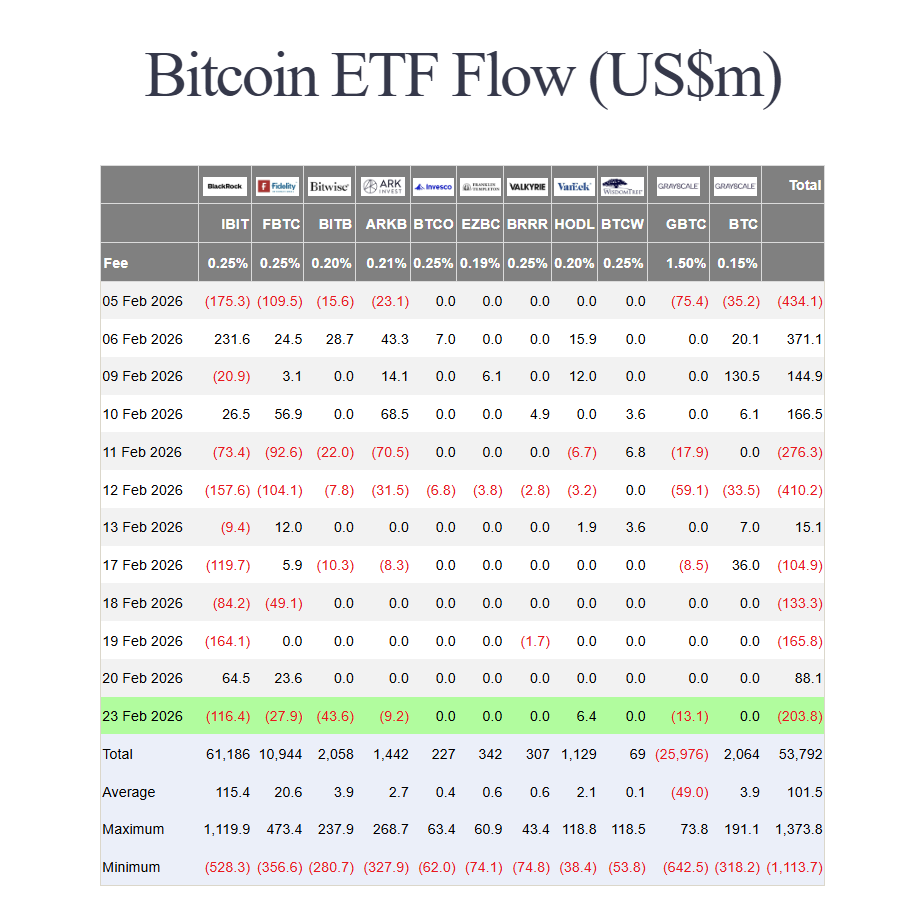
Key Observations:
- BlackRock IBIT and Fidelity FBTC saw repeated redemptions.
- GBTC continued to post meaningful outflows.
- Net flow volatility remains elevated compared to January.
February has become one of the most net-negative months since ETF launch volatility normalized.
Read more: What is Bitcoin ETF?
Ethereum ETF Flows, February 2026 Performance
Ethereum ETF flows have been similarly pressured:
- Feb 5: –$80.8M
- Feb 11: –$129.1M
- Feb 12: –$113.1M
- Feb 19: –$130.1M
- Feb 23: –$49.5M
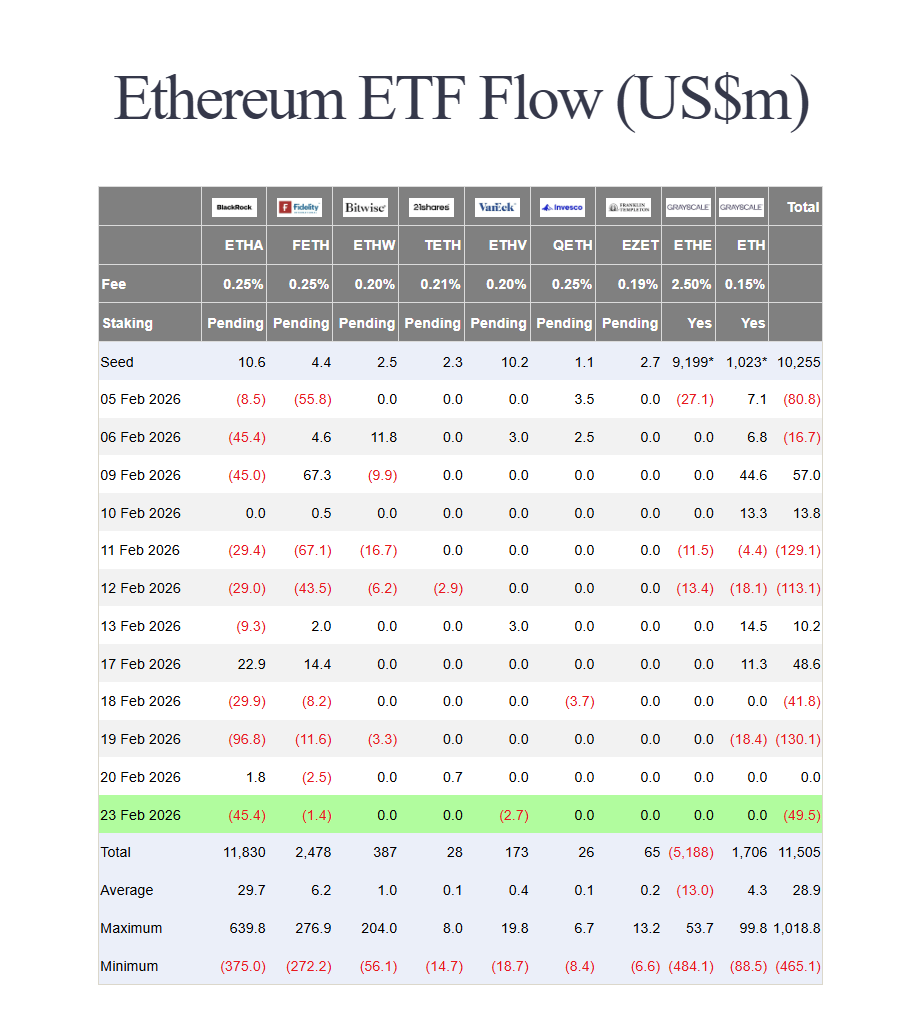
Unlike Bitcoin, ETH ETFs have struggled to post sustained inflow days. BlackRock’s ETHA saw repeated drawdowns, while Grayscale’s ETHE continues to face structural redemptions.
Also Read: BlackRock Seeds Ethereum Staking ETF With $100k
Bitcoin and Ethereum ETF Outflows vs 2022 Capitulation
In 2022, liquidity exited, without institutional buffers absorbing sell pressure. At the time, Bitcoin fell from nearly $47,000 to around $15,500. Ethereum declined from about $3,700 to below $900. There were no spot ETF vehicles absorbing flows or redistributing capital.
In 2026, spot ETFs for BTC and ETH now act as shock absorbers. Outflows do not automatically mean structural breakdown. They can reflect:
- Portfolio rebalancing
- Profit-taking after extended rallies
- Macro-driven allocation shifts
- Rotation into other digital assets
Institutional capital often reallocates rather than disappears. That distinction separates panic-driven capitulation from liquidity redistribution.
Source: CoinMarketCap
What Is Driving Crypto ETF Outflows?
Several structural drivers appear active:
• Macro uncertainty and tariff headlines
• Profit-taking after Q4 rally
• Rotation into stablecoin yield and structured products
• Diversification into altcoin or staking ETF narratives
ETF redemptions do not automatically signal capitulation. They can reflect strategic rebalancing.
Are BTC and ETH at Risk of Breaking Support?
ETF flows influence liquidity depth but do not independently determine price direction. Key levels to monitor include Bitcoin’s $64K–$65K support zone, see our detailed weekly trend and key level outlook in the Bitcoin weekly price forecast for more context, and Ethereum’s $1,850–$1,900 range, where critical support and resistance dynamics are highlighted in the Ethereum weekly price forecast.
If outflows stabilize while price holds support, this phase may represent institutional rotation. However, if outflows intensify alongside a technical breakdown, downside risk expands.
Is This Institutional Selling or Market Rotation?
The current environment appears defined more by liquidity rotation than outflow headline number. Market observers are closely watching whether ETF outflows accelerate further or stabilize. If ETF inflows resume while exchanges continue to show asset withdrawals, that may indicate long-term positioning. In contrast, simultaneous ETF outflows and exchange inflows could signal broader distribution.
That does not eliminate downside risk. It changes the framework through which risk must be measured. February data currently suggests controlled stress rather than panic liquidation.
Importantly, institutional capital does not simply vanish during volatility. It reallocates. Smart money rotation can create temporary stress without triggering structural collapse. Therefore, evaluating structure, liquidity, and sentiment together offers a more complete assessment than flow data alone.
Conclusion
February 2026 has become one of the heaviest ETF outflow months since launch, but the market structure differs significantly from 2022. Spot ETFs now function as institutional liquidity channels rather than pure speculative vehicles. The real question is no longer whether flows are red, it is whether the system is redistributing liquidity or withdrawing it entirely.
FAQs
1. Why are Bitcoin and Ethereum ETFs seeing outflows?
Bitcoin and Ethereum ETFs are experiencing outflows due to portfolio rebalancing, profit-taking, and macro uncertainty. Large withdrawals do not always signal panic selling but can reflect institutional allocation shifts.
2. Are these the biggest crypto ETF outflows since 2022?
Yes, recent Bitcoin and Ethereum ETF redemptions rank among the largest since the 2022 crypto bear market cycle.
3. Will Bitcoin fall below key support?
Bitcoin is currently defending major support in the mid-$60,000 range. A break below this level with strong volume could increase downside pressure.
4. Why is Ethereum falling more than Bitcoin?
Ethereum has shown higher volatility during periods of ETF outflows and often reacts more sharply to liquidity shifts.


