
This guide provides a MIRA crypto price prediction using technical indicators such as RSI, MACD, and moving averages. Explore MIRA price forecasts for today, this week, and the long term through 2040, along with key support and resistance levels, momentum analysis, and market outlook. Whether you are tracking short-term price action or evaluating future potential, this forecast offers a data-driven view of MIRA’s expected performance.
Mira (MIRA) is currently trading at $0.0477, holding a modest recovery after touching a fresh all-time low earlier this week, as per the latest TradingView chart. The 14-day RSI stands at 54.99, signalling a shift back to neutral-to-positive momentum, while the 20-day, 50-day, 100-day, and 200-day EMAs are positioned at $0.0443, $0.0503, $0.0638, and $0.1072, respectively.
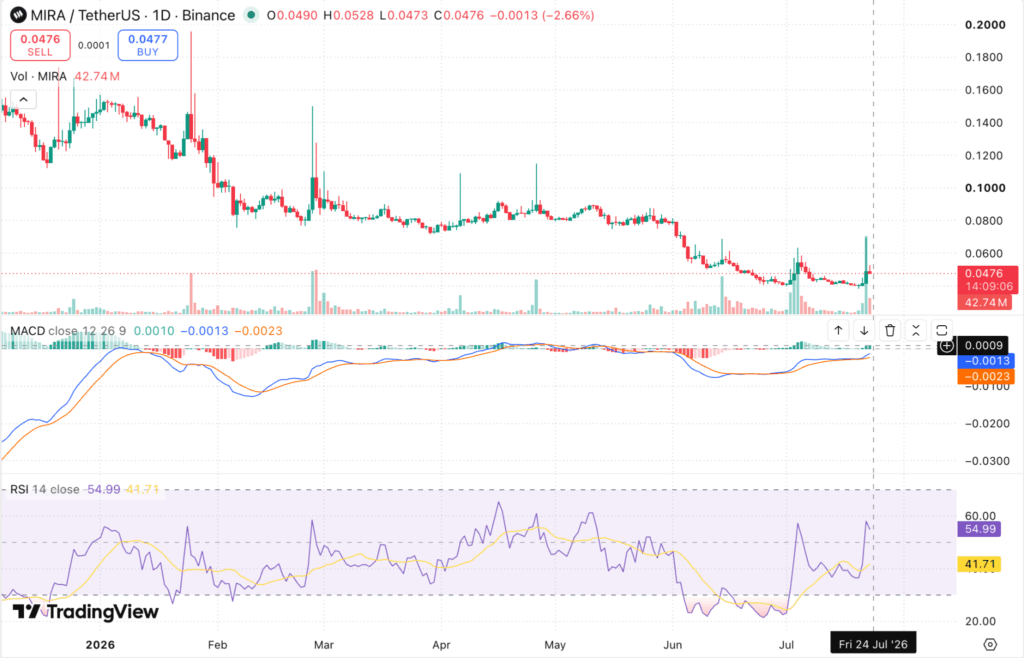
MIRA/USDT, Source: TradingView
Key Insights
- Short-term outlook: MIRA is trading above its 20-day EMA at $0.0443 but remains capped by the 50-day EMA at $0.0503, which marks the first genuine hurdle for buyers. A daily close above that level would open the door toward $0.0528, the high printed during this week’s volume spike.
- Medium to long-term outlook: For the MIRA price prediction 2026, the token has to reclaim the 50-day EMA before anything larger comes into play. The 100-day EMA at $0.0638 is the next checkpoint, while the 200-day EMA at $0.1072 remains the major long-term resistance and the level that would confirm a trend reversal.
- Technical analysis: RSI at 54.99 sits well above its own moving average at 41.71, and the MACD histogram has flipped positive at 0.0010 with the MACD line at -0.0013 crossing above the signal line at -0.0023. Momentum is improving, though both MACD lines remain below the zero line, so the recovery is early rather than confirmed.
MIRA Short-Term Price Prediction – Today, This Week, July 2026
Here is the MIRA price prediction 2026 for today, this week, and July 2026.
| Timeframe | Price Target | Support | Resistance | ROI |
| Next 24 Hrs | $0.0490 | $0.0473 | $0.0490 | +2.73% |
| This Week | $0.0503 | $0.0443 | $0.0503 | +5.45% |
| July 2026 | $0.0528 | $0.0443 | $0.0528 | +10.69% |
MIRA Crypto Price Prediction Today
MIRA is trading near $0.0477 and could revisit the $0.0490–$0.0503 zone in the next 24 hours if the current bid holds. Immediate support sits at $0.0473, the session low, while the 50-day EMA at $0.0503 remains the level that decides whether this bounce has legs.
MIRA Token Price Prediction for This Week
MIRA is projected to trade between $0.0443 and $0.0503 this week. The token is holding above its 20-day EMA but still trades under the 50-day EMA at $0.0503, making that the breakout zone to watch. A daily close above $0.0503 would improve MIRA’s short-term price outlook and put $0.0528 back in play. On the downside, a slip below $0.0443 would hand control back to sellers and reopen the recent lows near $0.0385.
MIRA Coin Price Prediction for July 2026
The MIRA price prediction July 2026 targets $0.0528, within a range of $0.0443–$0.0528. With only a handful of sessions left in the month, the realistic ceiling is the swing high set during Monday’s 42.45 million token volume spike. A monthly close above $0.0503 would mark the first higher close against the 50-day EMA since early June and strengthen the case for a July base. However, MIRA needs to keep defending $0.0443 for that constructive read to hold.
Read more: How to buy Crypto in India
MIRA Token Price Prediction for August 2026
MIRA’s August 2026 price prediction targets $0.0570, with a range of $0.0503–$0.0570. If MIRA reclaims the 50-day EMA at $0.0503 and turns it into support, buyers may attempt a run at the 100-day EMA near $0.0638. A sustained move above $0.0570 would improve the MIRA token price prediction for Q3 2026. Should the token fail to hold $0.0503, expect another stretch of consolidation between $0.0443 and $0.0530.
MIRA Price Prediction 2026 (Medium Term)
| Month | Price Target | Support | Resistance | ROI |
| July 2026 | $0.0528 | $0.0443 | $0.0528 | +10.69% |
| Aug 2026 | $0.0570 | $0.0473 | $0.0570 | +19.50% |
| Sep 2026 | $0.0638 | $0.0503 | $0.0638 | +33.75% |
| Oct 2026 | $0.0720 | $0.0570 | $0.0720 | +50.94% |
| Nov 2026 | $0.0890 | $0.0638 | $0.0890 | +86.58% |
| Dec 2026 | $0.1072 | $0.0720 | $0.1072 | +124.74% |
MIRA’s 2026 price range is projected at $0.0443–$0.1072 based on the current EMA structure. The 20-day EMA at $0.0443 is the key short-term support, while the 200-day EMA at $0.1072 remains the major long-term resistance. For MIRA to confirm a stronger bullish reversal, it must reclaim $0.0503 first and then work toward $0.0638. Until that happens, the MIRA price prediction stays cautiously constructive on the short-term chart but still bearish on the broader trend, with monthly token unlocks continuing to add supply through the second half of the year.
Want to diversify beyond MIRA? Check out the Top 10 Cryptos To Invest In July 2026
MIRA Price Prediction in INR (2026–2030)
For Indian traders, here is what the MIRA price prediction in INR looks like across the key horizons.
| Period | MIRA Target USD | MIRA Price INR est. |
| July 2026 | $0.0528 | ₹5.09 |
| December 2026 | $0.1072 | ₹10.34 |
| 2027 | $0.1400 | ₹13.51 |
| 2030 | $0.5200 | ₹50.18 |
INR estimates based on a USD/INR rate of ~₹96.5. Rate fluctuations will affect actual INR values; verify at the time of trade.
MIRA Long-Term Price Outlook (2027–2040)
The long-term outlook for MIRA rests on three structural drivers: real demand for its AI verification layer as autonomous agents move into regulated domains, the completion of its multi-year vesting schedule that currently keeps roughly 70% of supply locked, and the broader AI-infrastructure narrative retaining institutional attention through the next market cycle.
The following forecasts are derived from network-adoption modelling, comparable AI-infrastructure token valuations, and historical MIRA volatility patterns. They represent scenario ranges, not price targets.
| Year | Price Target | Support | Resistance | ROI |
| 2027 | $0.1400 | $0.0900 | $0.2000 | +193.50% |
| 2028 | $0.2200 | $0.1400 | $0.3200 | +361.22% |
| 2029 | $0.3500 | $0.2200 | $0.5000 | +633.75% |
| 2030 | $0.5200 | $0.3500 | $0.7500 | +990.15% |
| 2031 | $0.6800 | $0.4500 | $0.9500 | +1,325.58% |
| 2035 | $1.2500 | $0.8000 | $1.8000 | +2,520.55% |
| 2040 | $2.1000 | $1.3000 | $3.0000 | +4,302.52% |
Where Will MIRA Price Go in 2030?
MIRA’s 2030 price prediction targets $0.52, within a range of $0.35–$0.75. By then the bulk of the token’s vesting schedule will have cleared, removing the supply overhang that has defined its first two years of trading. At $0.52 with the full billion tokens in circulation, MIRA would carry a fully diluted valuation near $520 million, which is in line with mid-tier AI infrastructure protocols today rather than an outlier assumption.
Where Will MIRA Price Go in 2031?
The MIRA price prediction for 2031 targets $0.68, with a range of $0.45–$0.95. This assumes the network’s verification volumes keep compounding and that staking absorbs a meaningful share of float. The metrics worth watching here are daily verification queries, active node operators, and the proportion of supply staked rather than sitting on exchanges.
Where Will MIRA Price Go in 2040?
By 2040, MIRA’s price is projected at $2.10, ranging from $1.30 to $3.00, on the assumption that verifiable AI output becomes standard infrastructure rather than a niche service. That upper band would still place MIRA marginally above its September 2025 all-time high of $2.61 only in the most aggressive scenario. These are 14-year projections carrying high uncertainty and should be read as scenario ranges, not fixed targets.
MIRA Technical Analysis
The following indicators were used to derive the MIRA price analysis above. Each value should be refreshed at the time of publishing.
| Indicator | Value | Signal |
| Relative Strength Index 14-Day RSI | 54.99 | Neutral, improving |
| RSI Moving Average | 41.71 | Recovery confirmed |
| 20-Day EMA | $0.0443 | Short-term support |
| 50-Day EMA | $0.0503 | Key resistance |
| 100-Day EMA | $0.0638 | Major resistance |
| 200-Day EMA | $0.1072 | Long-term resistance |
| MACD (12, 26, 9) | -0.0013 | Bullish crossover |
| MACD Signal / Histogram | -0.0023 / +0.0010 | Momentum turning up |
| Daily Trading Volume | 42.45M MIRA | Elevated on the bounce |
Relative Strength Index RSI
The 14-day RSI is at 54.99, back in neutral territory after dipping under 30 through June. MIRA is nowhere near overbought, which leaves buyers room to push higher if the bid persists. More telling is the gap between RSI and its own moving average at 41.71, a spread that usually accompanies a genuine momentum shift rather than a dead-cat bounce. A move above 60 would reinforce the bullish MIRA price prediction, while a slide back under 50 would signal the recovery is stalling.
Moving Averages 20-Day, 50-Day, 100-Day and 200-Day EMA
MIRA is trading above its 20-day EMA at $0.0443, which supports the near-term recovery. It remains below the 50-day EMA at $0.0503, the 100-day EMA at $0.0638, and the 200-day EMA at $0.1072. The EMAs are also still stacked in bearish order, with each longer average sitting above the shorter one. That tells you MIRA has regained a footing but has not repaired the broader downtrend. A breakout above $0.0503 would be the first real positive signal, while a close above $0.0638 would meaningfully strengthen the MIRA token price prediction for the months ahead.
MACD Moving Average Convergence Divergence
The MACD line at -0.0013 has crossed above the signal line at -0.0023, pushing the histogram positive at 0.0010. This is the first clean bullish crossover since the June breakdown. The caveat is that both lines remain under the zero line, which historically marks these setups as counter-trend rallies until the MACD line clears zero. Traders using the MIRAUSDT price prediction as a framework should treat a zero-line reclaim as the confirmation trigger.
Volume Analysis
MIRA registered roughly 42.45 million tokens of daily volume on the bounce off its all-time low, well above the June average. Rising volume during a breakout above $0.0503 would confirm real buying conviction. If volume fades while price stalls under the 50-day EMA, the more likely outcome is continued consolidation in the $0.0443–$0.0530 band.
What Is the MIRA Price Prediction for Indian Traders?
Mira Network is building a decentralised verification layer for AI, routing model outputs through multiple independent AI systems and requiring consensus before a result is accepted. The pitch is to make AI usable in healthcare, legal, and financial settings where an unverified answer is not acceptable. The project raised $9 million in seed funding led by BITKRAFT and Framework Ventures, and its consumer app Klok has drawn several million users to date.
Two things matter most for Indian traders here. The near-term catalyst is the rollout of verified outputs across the Klok app and upgraded developer tooling, which would tie token demand directly to network usage rather than to speculation. The near-term risk is supply. Only about 28% of the one-billion token cap is circulating, and scheduled unlocks from ecosystem reserves, the foundation, and early investors continue on a monthly cadence. That overhang has weighed on MIRA all year and is the single clearest explanation for the drawdown from $2.61.
Indian traders can buy, sell, and trade MIRA directly on CoinDCX in INR, with no USD conversion and no international transfer required. At roughly ₹4.60 per token today, the entry point against a 2030 base case of ₹50.18 implies a potential 11x over four years under the base scenario, with the obvious caveat that small-cap AI tokens carry far higher downside risk than large-cap assets.
FAQs
Q1. What will 1 MIRA be worth in 2030?
1 MIRA's worth in 2030 will depend on number of factors. Most price models place MIRA between $0.35 and $0.75 by 2030, with a base case near $0.52. The outcome depends on whether the verification network attracts paying developer demand and how much of the supply ends up staked rather than traded.
Q2. Will MIRA hit $1?
Reaching $1 would put MIRA's fully diluted valuation at $1 billion, close to where it briefly traded in late 2025. Under the base case that level sits somewhere in the 2032–2033 window, though an aggressive adoption scenario could pull it into 2031. Treat it as a long-term milestone rather than a near-term target.
Q3. Is MIRA a good investment in 2026?
Whether MIRA will be a good investment in depends entirely on your risk tolerance. MIRA is a small-cap token with a market capitalisation near $14 million, meaning price swings are severe in both directions. The bull case rests on AI verification becoming necessary infrastructure. The bear case is straightforward: continued unlocks into thin demand. Position sizing matters more here than on any large-cap asset.
Q4. Will MIRA go up?
MIRA has staged a roughly 24% bounce off its all-time low of $0.0385 set on 20 July 2026, helped by a strong volume day and a bullish MACD crossover. Whether that extends depends on the token reclaiming its 50-day EMA at $0.0503. Below that level, rallies have consistently been sold this year.
Q5. Why is MIRA falling?
MIRA token’s price has fallen because supply has grown faster than demand. Scheduled monthly unlocks keep adding circulating tokens while the AI token sector has broadly derated since late 2025. Weak overall market sentiment and profit-taking from early holders have compounded the move. Until buyers reclaim key resistance zones, the path of least resistance stays lower.
Q6. What is MIRA's all-time high (ATH)?
MIRA reached its all-time high of $2.61 on 26 September 2025, shortly after its exchange debut. The token now trades roughly 98% below that peak, which is a common pattern for 2025-cohort launches that are listed with a low float and a heavy vesting schedule behind them.
Q7. What is MIRA used for?
The MIRA token has three functions: staking to secure the verification network, governance over protocol decisions, and payment for API access and verification services. That third use is the one that links token demand to actual network activity, and it is the metric worth tracking above price.
Q8. How high will MIRA go in 5 years?
By 2031, MIRA price predictions range from $0.45 to $0.95, with a base case near $0.68. The upper band assumes the AI infrastructure sector recovers institutional interest and that Mira captures a meaningful share of the verification market. The 2028 unlock completion is the key structural milestone between now and then.
Q9. Will MIRA recover from the bear market?
MIRA's recovery depends on demand outpacing the remaining supply release. The technical picture has improved for the first time since June, with RSI back above 50 and MACD crossing bullish, but a durable recovery needs MIRA to clear its 100-day EMA at $0.0638 and hold there. Anything below that is a bounce within a downtrend.
Q10. What is the MIRA price prediction for 2026 in INR?
At a December 2026 target of $0.1072 and a USD/INR rate near ₹96.5, MIRA could trade around ₹10.34 by year-end 2026. Indian traders can buy MIRA directly on CoinDCX in INR without any USD conversion.
Q11. What will MIRA be worth in 2040?
Long-term adoption models project MIRA between $1.30 and $3.00 by 2040, with a base case near $2.10. These are high-uncertainty scenario ranges over a 14-year horizon and depend on Mira holding its position against competing AI verification and oracle protocols.
Disclaimer
This article is for informational purposes only and does not constitute financial or investment advice. Digital asset markets are highly volatile and prices can change rapidly. Past performance is not indicative of future results. The price predictions above are based on technical and on-chain analysis and should not be construed as investment recommendations. Always conduct your own research before making any trading or investment decisions.