


Bitcoin is trading near a critical technical zone after a sharp sell-off pushed the asset close to oversold territory on the Relative Strength Index (RSI). The move comes just days before the release of U.S. Consumer Price Index (CPI) data, a macroeconomic event that could influence risk sentiment across global markets.
With BTC attempting to hold the psychologically important $60,000 support region, traders are closely monitoring whether the latest Bitcoin RSI reading signals a potential relief rally or further downside pressure. The setup has renewed interest in terms such as Bitcoin oversold levels, BTC RSI, and whether Bitcoin is currently oversold.
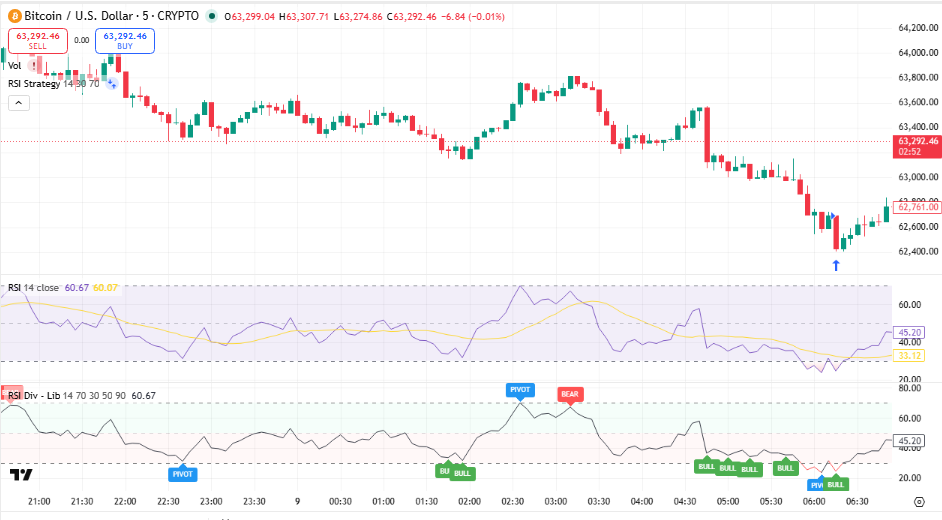
Source: TradingView
Bitcoin RSI Shows Extreme Market Pressure
The Relative Strength Index (RSI) serves as a widely used Bitcoin oversold indicator that traders use to analyze the rate and magnitude of price changes. Usually, an RSI value under 30 points indicates an oversold condition, meaning selling pressure has intensified relative to buying pressure. Bitcoin’s recent drop in RSI levels has pushed the indicator to some of its lowest points over the past few years. Comparable figures were seen during periods of major market stress, especially in March 2020, when global markets experienced high volatility.
Looking at the current pattern, we see BTC attempting to find support after the recent fall. Buyers have kept on checking the $60,000 level, which is still a major psychological point for the market players. Holding this region could enable Bitcoin to gain strength, whereas a breakdown here could lead to increased selling pressure toward the lower support zones. Many traders are asking, “Is Bitcoin oversold?” with the RSI indicator drawing attention due to its historically low reading. Nevertheless, the relative strength index RSI by itself cannot validate a rally in the trend, and it requires confirmation from other market components.
For beginners, understanding what an oversold RSI reading means can help put current market conditions into perspective.
CPI Data Becomes the Next Market Focus
Technical indicators still hold their importance. However, traders are now starting to put more emphasis on the release of the U.S. CPI report. Inflation data is a significant factor that determines expectations of monetary policy, and it also has the potential to influence the financial markets worldwide. Lower inflation statistics could work in favor of investors as they might regain their confidence, resulting in higher demand for Bitcoin, whereas if the inflation data is robust, the market might get a bit cautious as expectations would be readjusted.
Due to the close relationship between the two, macroeconomic data flow continues to influence the price of Bitcoin. The elements such as economic data, liquidity, and market participation have been monitored by traders to figure out the next price movement. Additionally, the volatility of Bitcoin lately has been a sign of a bigger situation of uncertainty, where the signals from technical analysis and the economic ones are coming together. The inflation report could influence broader crypto sentiment heading into the second half of the year.
For a bigger-picture view, see our Crypto Bull Run Outlook 2026.
Support Levels Remain Important for BTC Trend
Bitcoin’s price action is currently centered around key technical levels. The $60,000 region continues to act as a major area watched by traders, while recovery attempts toward higher resistance zones remain possible if buying interest strengthens. A sustained recovery would likely require stronger demand and confirmation from momentum indicators. The RSI improving from oversold conditions could support a positive shift, but traders will also look for higher highs and stronger volume before considering a broader trend change. For crypto Bitcoin market participants, the current environment highlights the importance of combining technical analysis with fundamental developments. Indicators such as RSI provide insight into momentum, while events like CPI releases can create additional market movement.
Conclusion
Bitcoin’s RSI reaching its lowest level since 2020 has placed the market in a closely watched technical zone. The oversold reading shows strong selling pressure, but historical data shows that deeply oversold conditions have often been followed by a technical rebound in Bitcoin’s price. With CPI data approaching, traders are monitoring both macroeconomic signals and Bitcoin’s ability to defend key support levels. The coming sessions may provide clearer direction as Bitcoin market participants evaluate whether BTC can regain momentum or continue its current consolidation phase.
Traders looking at longer-term scenarios can also explore our latest Bitcoin Price Prediction

