


Date: June 4, 2026
1. Market Summary
The digital asset market has entered a severe capitulation phase, with Bitcoin plummeting to $62,576 and triggering deep market-wide liquidations. The broad market sell-off has temporarily invalidated recent relative-strength anomalies, violently shifting the trading landscape toward mean-reversion and oversold bounce setups. Capital flight is accelerating, evidenced by a staggering $3.5B in stablecoin outflows over the past seven days. Notably, prominent market figures are actively de-risking; reports indicate major funds and vocal ecosystem proponents have exited significant altcoin positions, citing looming macroeconomic and political headwinds.
2. Structural Spotlight: Real World Assets (RWA)
While speculative altcoins face heavy distribution, the Real World Asset (RWA) and tokenization sector continues to build undeniable institutional momentum. Traditional finance integration is accelerating rapidly—highlighted by top-tier investment banks partnering with digital asset infrastructure firms to launch tokenized real estate funds, and payment giants expanding their on-chain settlement capabilities. This aligns cleanly with a growing global regulatory lean toward tokenization, providing a long-term structural tailwind for RWA infrastructure assets, even as broader crypto liquidity drains.
3. Major Assets Overview
| Asset | Performance/Drivers | 24H Outlook | Levels |
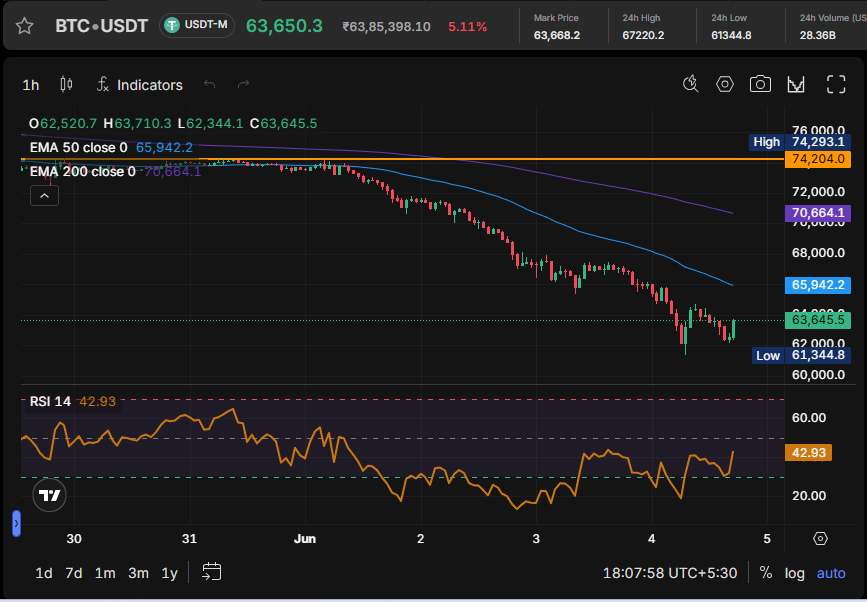
| BTC | Trading at $62,576. The asset has crashed below critical moving averages, driven by extreme fear and capital outflows. Notably, BTC funding rates have flipped negative (-3.1% annualized) for the first time in this cycle, while Open Interest has collapsed by 13.2% as leverage is wiped out. | Highly vulnerable but deeply oversold. A historic “Power Law” support metric has flashed, which has traditionally marked cyclical bottoms. Must hold $61,345. | R: $76,608 S: $61,345 |
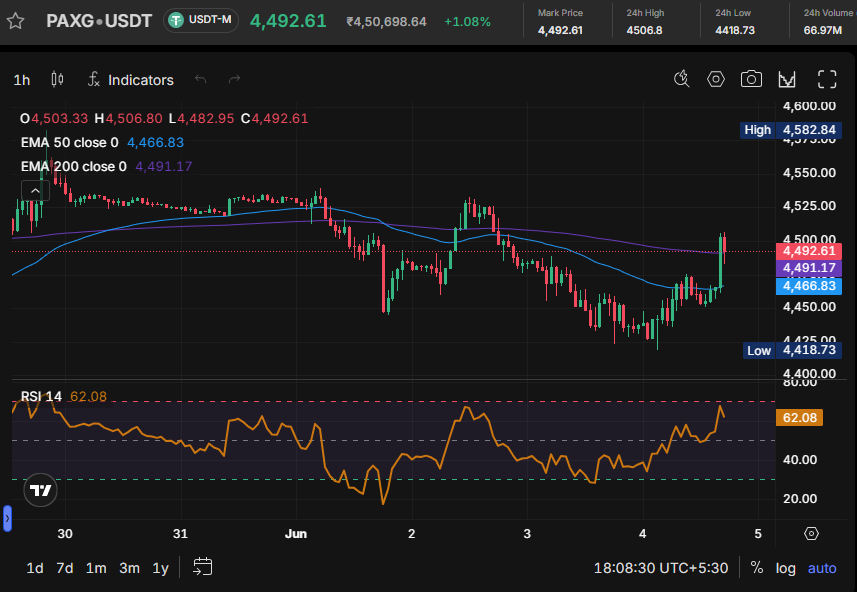
| GOLD / PAXG | Spot Gold: $4,532.80 (+2.2%). Acting as a primary beneficiary of the crypto and equity market sell-offs. | Structurally accelerating. The safe-haven rotation is in full effect with a confirmed 5-day rising trend. | Spot: $4,532.80 |
4. Trade Setups & Monitoring
With market breadth crushed to just 6% and blue-chip breadth at an absolute 0%, standard directional breakouts are completely invalid. We are now targeting capitulation bounces (mean reversion) where forced liquidations have exhausted selling pressure.
Primary Watchlist
- FIL (Mean Reversion LONG): FIL is presenting a capitulation structure after a period of intense distribution. The asset has reached deeply oversold territory, accompanied by a notable 4.0% drop in open interest, suggesting that forced long liquidations may have largely concluded. With funding rates shifting heavily negative (-65.5% annualized), the structural conditions could support a mechanical short-squeeze if broader selling pressure subsides. (Vol: $241M, M-Cap: $667M)
- WLD (Support Reaction LONG): WLD is exhibiting signs of stabilization near local lows, characterized by a rejection structure on lower timeframes. Despite the broader market drawdown, open interest has aggressively expanded by over 15%, indicating strong institutional absorption rather than capitulation. Funding rates remain mildly negative (-4.1% annualized), pointing toward a healthy accumulation phase amid the volatility. (Vol: $1.3B, M-Cap: $1.6B)
Secondary Watchlist
- TRUMP (Mean Reversion LONG): TRUMP has experienced a severe volatility flush, leading to a deep oversold reading across momentum indicators. A massive 17.38% wipeout in open interest suggests the bulk of over-leveraged positioning has been cleared. Early signs of buyer intervention are forming near the lower bounds, presenting a high-volatility structural anomaly for market participants monitoring mean-reversion conditions. (Vol: $92M, M-Cap: $426M)
- BTC & ETH (Support Bounces): Both majors have printed long-wick rejection structures near local lows ($62,645 and $1,755, respectively). Open interest has collapsed by roughly 13% to 15% across both assets, clearing out excess leverage and resetting the playing field. These conditions are typically monitored for short-term stabilization rather than immediate directional breakouts. (BTC Vol: $27.7B | ETH Vol: $17.6B)
5. Strategic Execution Guidelines
- Regime Rules: Do not attempt to construct long-term swing positions while stablecoins are heavily outflowing.
- Execution Focus: Trade setups today are exclusively focused on monitoring post-liquidation stabilization. Market participants should prioritize strict adherence to structural support limits over chasing unconfirmed bounces.
Terminology Glossary
- Breadth: The percentage of tracked crypto assets that are currently positive (green) on the day. e.g., 6% breadth means 94% of the market is actively losing value.
- Open Interest (OI): The total nominal value of outstanding derivative contracts. Rising OI means fresh money is entering; falling OI usually means forced liquidations or traders closing positions.
- Funding Rate: A periodic fee exchanged between long and short traders to keep the futures price pegged to the spot price. Heavily negative funding means shorts are crowded and paying longs.
- RSI (Relative Strength Index): A momentum oscillator ranging from 0 to 100. Readings below 30 typically indicate an asset is oversold and due for a mechanical bounce.
- Power Law: A long-term mathematical trend model for Bitcoin that outlines its historic absolute price floor based on logarithmic time constraints.
Disclaimer: The content provided in this report is strictly for informational and educational purposes based on automated raw data feeds. It does not constitute financial, investment, or trading advice, nor does it represent an official endorsement or recommendation to buy or sell any digital asset. Cryptocurrency trading involves extreme risk and volatility. Traders should conduct their own thorough independent research and consult a certified professional before committing capital.

