


Macro Overview
- US Nonfarm Payrolls: US Nonfarm Payrolls increased by 130,000 in January, surpassing the 70,000 forecast and indicating stronger-than-expected job growth, which carries a slightly bearish tone for the market.
- US CPI Inflation: US headline CPI inflation eased to 2.4% year-over-year in January, coming in slightly below market expectations of 2.5%, which is bullish for the market.
- US Unemployment Claims: Reported in line with expectations, signaling a neutral to slightly bullish outlook for crypto, as it supports investor confidence without raising immediate concerns about aggressive rate hikes.
Crypto Markets Overview
- Market Movement: This week, the crypto market declined by 1.71%, pushing total market capitalization down to $2.33 trillion. Bitcoin dropped 2.12%, while Ethereum fell 5.90%. Bitcoin’s market dominance stands at 59.09%, with Ethereum accounting for 10.19%.
- Bitcoin Stabilizes Near $70K After $8.7B Flush, Sentiment Still Fragile: Bitcoin is hovering around $70,000 after retesting the level on the back of softer U.S. inflation data, helping revive short-term risk appetite following an $8.7 billion sell-off.
- Bitcoin Near Key Support as Extreme Fear Signals Oversold Conditions: Bitcoin is trading around $68,700 with the Fear & Greed Index near 9, reflecting extreme fear and deeply oversold RSI levels that historically precede recoveries.
- Crypto Fear & Greed Index Falls to COVID-Era Lows: The Crypto Fear & Greed Index has dropped to levels last seen during the March 2020 COVID-19 market crash, reflecting extreme caution among investors.
Top Altcoins Update & ETF Updates:
- Altcoin Market Drops 21% as Crypto Uncertainty Intensifies: The broader altcoin sector has fallen 21% year-to-date in 2026, with Ethereum playing a major role in the overall decline. The pronounced deterioration in sentiment reflects continued fragility and elevated uncertainty across the wider digital asset market.
- Significant ETH Accumulation: BitMine has recently increased its treasury holdings to approximately 4.326 million Ethereum — nearly 3.58% of the total circulating supply continuing to accumulate tens of thousands of ETH despite broader market weakness.
- Solana Shows Resilience Amid Broad Crypto Outflows: Solana-oriented funds attracted around $31M in inflows, despite the wider crypto market seeing $173M in outflows, suggesting continued investor interest in SOL amid overall market weakness.
- Coinbase Reports $667 Million Q4 Loss: Coinbase reported a $667 million loss in Q4, reflecting weaker trading volumes, market volatility, and higher operating costs during the quarter. The loss highlights ongoing pressure on crypto exchanges amid fluctuating market conditions and shifting investor sentiment.
- Trump Media Submits Filing for Bitcoin & Ethereum ETFs: The prominent filing for Bitcoin, Ethereum, and CRO ETFs highlights sustained investor demand for regulated cryptocurrency investment vehicles.
- Major Banks Enter Crypto ETF Market: Wall Street institutions, including Morgan Stanley, have filed for Bitcoin, Ethereum, and Solana ETFs, signaling growing institutional participation in digital asset investment products.
Geopolitical & Market update
- Middle East and Regional Tensions: Continued global negotiations, such as U.S.–Iran talks, are fostering caution across financial markets, with the effect spilling into crypto via reduced risk appetite and slower capital inflows.
- Regulatory & Policy Actions: The European Commission plans to ban Russian crypto transactions as part of sanctions enforcement, potentially curbing crypto flows in targeted markets and raising compliance risks for regional crypto service providers.
“Big Picture: Upcoming Weeks Key Economic Events”
| DATE | TIME | EVENT | USUAL EFFECT |
| Feb 19 | 12:30 AM | US Unemployment Rate | Tightening or hawkish signals usually put downward pressure on prices, whereas easing or dovish cues often fuel short-term upward rallies. |
| Feb 19 | 7:00 PM | US Unemployment Claims | Actual greater than Forecast is good for crypto |
| Feb 20 | 7:00 PM | Advance GDP q/q | Strong growth can be mildly bearish, while weak growth can provide a bullish short-term catalyst. |
Bitcoin Technical Analysis
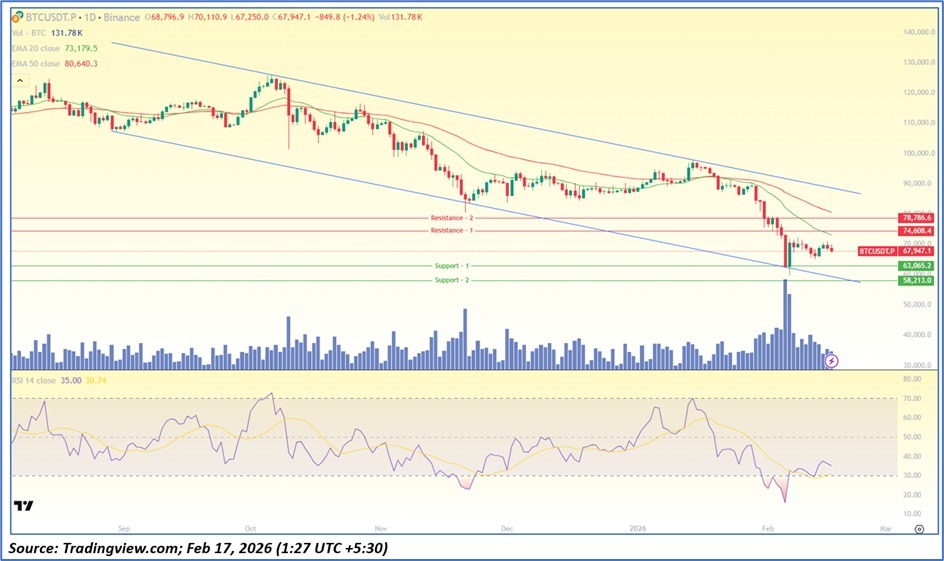
Summary:
- BTC Market Sentiment Appears Neutral to Slightly Bullish
- BTC found support at the lower boundary of its long-term descending channel and has started drifting higher, suggesting potential for further upside if the key support holds. However, the 20-period EMA may act as immediate resistance.
- Bitcoin’s bear bottom may hold above $55,000 rather than falling to lower forecasts, highlighting that oversold technical conditions could limit deeper declines.
- Momentum indicators such as the 14-period RSI point to easing selling pressure, though overall sentiment remains cautious, leaving the market at a critical inflection point.
- Key support stands near $63,000 and $58,200, while resistance lies between $74,600–$78,800; a breakdown could extend losses, though rising whale accumulation hints at potential supply exhaustion.
- Traders could look for long entries near the key support zones and short positions near resistance, using well-defined risk parameters.
- Profit targets can be planned around the highlighted support and resistance levels, while consistently adhering to disciplined risk management.
Ethereum Technical Analysis
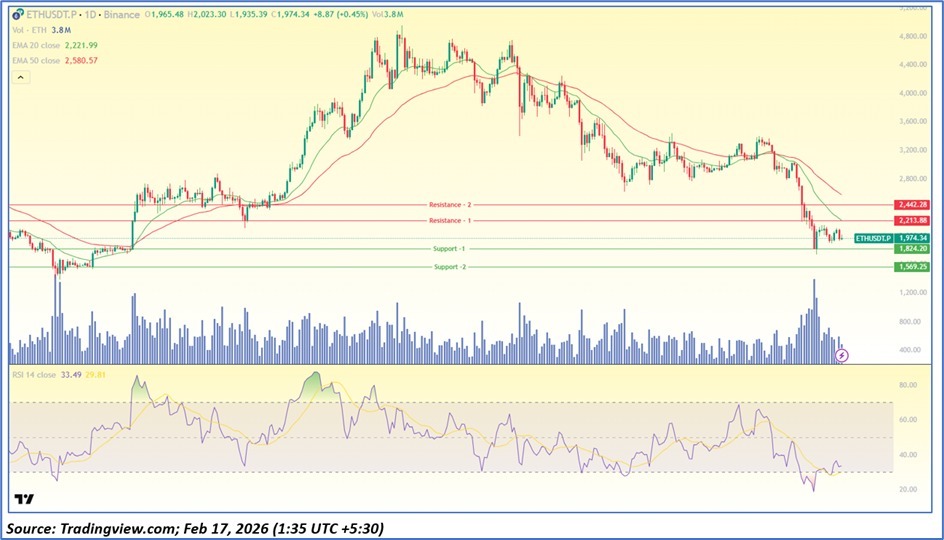
Summary:
- Ethereum has bounced exactly off the support levels mentioned in our previous commentary, with market sentiment remaining largely sideways.
- Ethereum, meanwhile, is consolidating near major support, with market participants watching for either a relief bounce or continuation of the broader corrective structure.
- Technical indicators, including the 14-period RSI, reflect diminishing bearish momentum, while broader market sentiment remains neutral-to-cautious, positioning price action at a pivotal inflection zone.
- Key support levels are located near $1,824 and $1,570, while important resistance levels to monitor are around $2,213 and $2,442.
- These levels are crucial for gauging potential price movements. Traders might look for long opportunities near the defined support zones and short setups near resistance, while employing proper risk management to limit potential losses.
Solana Technical Analysis
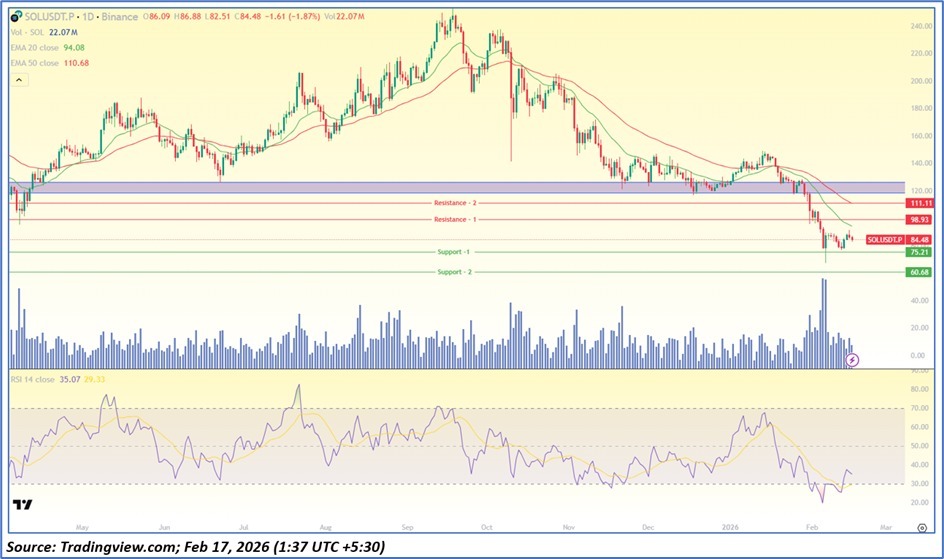
Summary:
- Market sentiment for SOL remains neutral to slightly bullish.
- Solana recently broke its short-term bearish trend, invalidating the downtrend and opening a potential path toward the $98 resistance zone, signaling a shift in near term momentum if the breakout holds.
- Technical indicators, including the 14-period RSI, show weakening bearish momentum, while overall sentiment remains cautious, placing price action at a critical inflection point.
- Key support zones are identified near $76 and $61, with significant resistance levels around $99 and $110.
- Traders may consider initiating long positions near support and short positions near resistance, applying disciplined stop-losses and booking profits around these levels to manage risk effectively.
Disclaimer: “The information, advise and/or views provided on this page are that of the author or company and are for informational purposes only. The Platform does not intend to: (i) an offer, or solicitation of an offer, to invest in, or to buy or sell, any interests or shares, or to participate in any investment or trading strategy, or (ii) to provide accounting, legal, or tax advice, or investment recommendations, or (iii) make any representation of any kind, express or implied, on accuracy, availability, reliability or completeness of the same. Note Crypto products and NFTs are unregulated and can be highly risky. There may be no regulatory recourse for any loss from such transactions. AT NO TIME WILL THE PLATFORM BE LIABLE FOR YOUR USE OR RELIANCE OF THE SAID INFORMATION, ADVISE AND/OR VIEW WHICH IS SOLELY AT YOUR OWN RISK.”
