


Frax is trading around $0.86 after a steady weekly gain, supported by renewed investor interest following its rebranding and expanding ecosystem developments. While short-term technicals remain neutral to slightly bearish, declining volatility and strong liquidity suggest consolidation rather than breakdown. With growing adoption across DeFi, recent exchange support, and improving sentiment, market attention is now focused on whether FRAX crypto can recover toward the $1.00–$1.02 range by January 2026.
Key Takeaways
- Current Status: FRAX is trading around $0.86, up 3–4% weekly, according to CoinMarketCap data. What sets this apart is investor enthusiasm getting a fresh boost after the patch, with FXS trading up to FRAX, giving the market a new breath. On top of that, the token’s community sentiment, higher trading volumes, and overall internet presence played a significant role in the token’s price stabilizing after it had been pushed down by broader market dips.
- Market Performance: Frax has a market cap that ranges between $76 million and $78 million, and it has recently registered $82 million in trading volume for one day, thus showing good liquidity. The healthy volume-to-market cap ratio is consistent with the idea of significant trading activity. In fact, fractionally-sized tokens have been the main driver of FRAX’s growth over the last seven days, and this is mainly because the entire ecosystem has come back into focus.
- Technical Analysis: After making a giant leap and then a slight dip, FRAX is demonstrating a short-term bearish-to-neutral pattern. The asset price is below the key moving averages, which point to continued dominance by sellers. Yet, the volatility indicators and momentum, which are both going down and becoming more horizontal, are indicating that the market is getting ready to move sideways. If the buyers can keep the current range safe from any further downside, FRAX may pull back from a local support level.
- Frax Price Prediction January 2026: Based on the staggering ecosystem adoption and positive sentiment, Frax price prediction models indicate almost an 18% rise, with the token most likely hitting $1.02 by the end of January 2026. Ongoing trading volumes, the overall market stability, and the developments that a continuous Frax project can bring are factors that could support this bullish scenario. If the price fails to regain upward momentum, it will most likely continue to trade within a range.
- Future Outlook: FRAX’s outlook is steady and constructive, as recent Binance listings, perpetual futures support, and the rollout of the Fraxtal network expand its reach and real-world utility. Integrations like FRAX-as-a-Service and growing interest from major DeFi platforms highlight its role as a core on-chain dollar. With deeper liquidity, stronger infrastructure, and broader adoption across DeFi and derivatives, FRAX is well-positioned to strengthen its ecosystem while maintaining its primary goal of stability, targeting a sustained $0.99–$1.01 range over the long term.
Trade FRAX in INR on ![]()
Deposit and withdraw in INR (₹).
No Conversion to Crypto Required.

Where Will Frax Price Head Next?
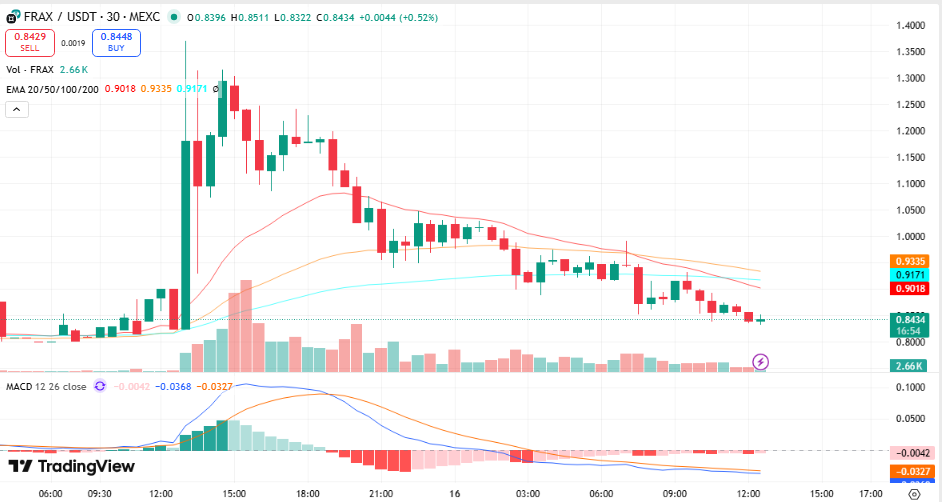
Frax Crypto Price Chart, Source: TradingView
- Currently, Frax’s price is below the 20-day and 50-day EMAs, which is a sign of continued short-term selling pressure. The inability to retake the $0.90 area means that the sellers are still in control. On the other hand, the price holding close to the $0.84 support level suggests a lack of selling pressure and the possibility of a base formation.
- The moving averages indicate a bearish trend, as the 20-day moving average has fallen below the longer-term averages. Such a scenario indicates the trend is weak and there is little bullish momentum to follow. Unless FRAX reverses the 20-day EMA convincingly, any upward movement is likely to be capped around the $0.90–$0.93 range.
- Support at $0.845 appears to be a key technical level, as it coincides with the recent lows of the consolidation and Fibonacci support. If the price breaks below the $0.808 level, it could trigger further retracements for FRAX, potentially reaching as low as $0.76. On the other hand, a bounce from this level might lead to some buying interest from short-term traders.
- The MACD line is temporarily in the negative zone, while the signal line is approaching the zero line and leveling off. This suggests that the bearish forces are not gaining more strength but rather losing some of it. A bullish crossover would certainly be a sign of the start of an upward movement; however, getting a confirmation would be necessary through an increase in volume and a close above the 20-day EMA.
FRAX/USD Technical Overview – 2026
| Indicator | $ Value |
|---|---|
| Support levels (Fibonacci, S1 / S2 / S3) | $0.8450 / $0.8080 / $0.7650 |
| Resistance levels (Fibonacci, R1 / R2 / R3) | $0.9020 / $0.9335 / $1.0000 |
| 20-day EMA | $0.9020 |
| 50-day EMA | $0.9335 |
| 100-day EMA | $0.9171 |
| 200-day EMA | $0.8089 |
| MACD level | -0.0017 |
Frax Price Prediction Daily
Frax has experienced a period of consolidation at around the $0.84–$0.86 zone. Thus, Frax would like to recover in the short term. The Frax price is projected to rise 3–5% and could hit $0.89 within the next 24 hours as volume stabilizes and selling pressure lessens. The short-term upward momentum could be boosted if buyers can take control of the $0.88–$0.90 range, whereas if the price fails to hold $0.84, it may be a while before it can go up again.
Disclaimer: Frax price predictions are speculative. Markets are volatile, do your own research before investing.
Frax Price Prediction Weekly
The next week is very likely to see Frax move within a well-defined range as the volatility comes down after the recent decline. If the overall market sentiment is neutral to positive, Frax may rise by 6–8% and reach the price range $0.92–$0.94 by the week’s end. Continual closes above the 20-day EMA would be a good sign for short-term traders considering getting in, while the resistance around $0.94 might be a bit of a barrier to any aggressive upward moves.
Disclaimer: Frax price predictions are speculative. Markets are volatile, do your own research before investing.
Frax Price Prediction January 2026
The future looks bright for Frax’s price stability, with occasional slight uptrend moves. According to Frax’s price prediction models, the token might increase by 12–15% and reach $0.98 by the end of January 2026. That is mainly because the coin has been consolidating above strong support levels, and overall sentiment is improving. On the other hand, the expansion of the ecosystem as well as the general direction of the crypto market will play a big role in how strong the upward move will be.
Frax Price Prediction February 2026
In February 2026, Frax could experience modest expansion if buyers maintain control above psychological support zones. The price of Frax is projected to rise by approximately 18–20% and may approach $1.02 by the end of February 2026. A successful breakout above $1.00 could reinforce bullish sentiment, while a rejection near resistance could lead to continued range-bound movement between $0.88 and $1.00.
Frax Coin Price in INR
| FRAX Amount | Price in INR (Approx) |
| 1 FRAX | ₹72 |
| 5 FRAX | ₹360 |
| 10 FRAX | ₹720 |
| 25 FRAX | ₹1,800 |
| 50 FRAX | ₹3,600 |
| 100 FRAX | ₹7,200 |
Frax Price Prediction Table (2026-2031)
| Year | Min Price ($) | Min (₹) | Avg Price ($) | Avg (₹) | Max Price ($) | Max (₹) | ROI (Avg %) |
| 2026 | 0.75 | ₹62 | 0.92 | ₹76 | 1.10 | ₹91 | — |
| 2027 | 0.90 | ₹75 | 1.15 | ₹95 | 1.40 | ₹116 | +25% |
| 2028 | 1.10 | ₹91 | 1.45 | ₹120 | 1.80 | ₹149 | +58% |
| 2029 | 1.35 | ₹112 | 1.85 | ₹154 | 2.30 | ₹191 | +101% |
| 2030 | 1.70 | ₹141 | 2.25 | ₹187 | 2.80 | ₹232 | +144% |
| 2031 | 2.10 | ₹174 | 2.85 | ₹237 | 3.50 | ₹291 | +210% |
FAQs
1. Is Frax a good investment?
Frax is known for its innovative fractional-algorithmic stablecoin system. The ecosystem includes FRAX, designed to maintain a stable value close to $1, and Frax Share (FXS), which serves as the governance and value-accrual token. While the Frax protocol has been widely respected in the DeFi space for its design and experimentation, FXS remains a volatile and speculative asset. Its long-term performance depends on the adoption of the Frax ecosystem, protocol revenue, and overall DeFi market growth. Investors should approach with caution and conduct their own research.
2. What is the all-time high for Frax?
Frax Share token FXS reached its all-time high at approximately $42.7 USD in April 2022 during a strong DeFi market rally. Since then, the token has traded significantly below that peak.


