
This guide provides an AIA (DeAgentAI) crypto price prediction using technical indicators such as RSI, MACD, and moving averages. Explore AIA price forecasts for today, this week, and the long term through 2040, along with key support and resistance levels, momentum analysis, and market outlook. Whether you are tracking short-term price action or evaluating future potential, this forecast offers a data-driven view of DeAgentAI’s expected performance.
DeAgentAI (AIA) is currently trading at $0.0662, up 3.29% on the day and extending a recovery that has run since the token set its all-time low of $0.04729 on 24 June 2026, as per the latest TradingView chart. The 14-day RSI stands at 71.32, pushing into overbought territory for the first time since April, while the 20-day, 50-day, 100-day, and 200-day EMAs are positioned at $0.05634, $0.05680, $0.07824, and $0.24152, respectively.
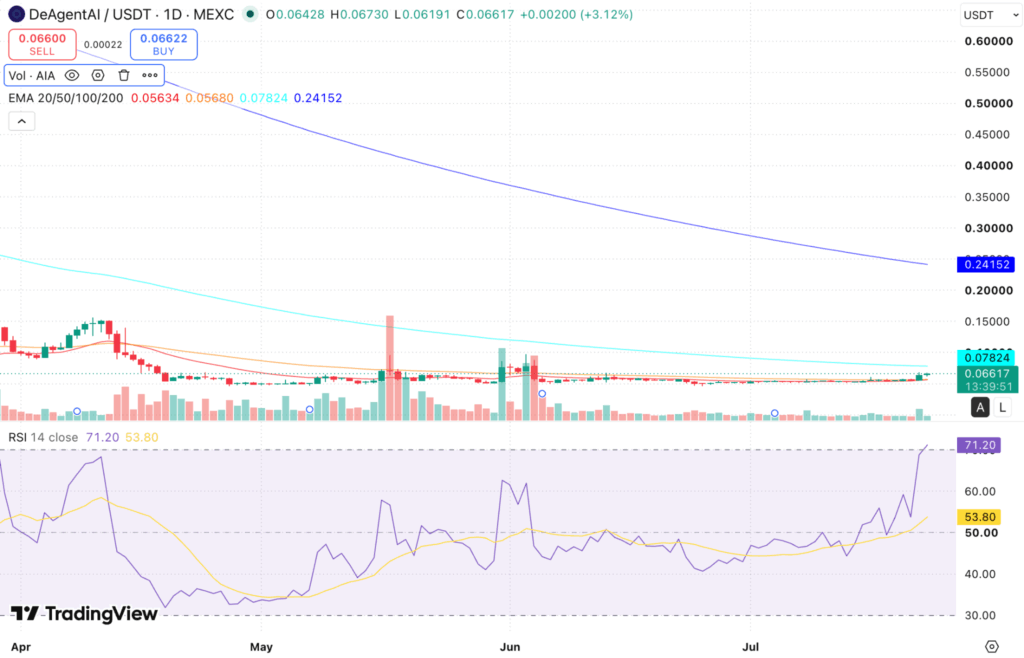
AIA/USDT, Source TradingView
Key Insights
- Short-term outlook: AIA is trading above both its 20-day EMA at $0.05634 and its 50-day EMA at $0.05680, the first time it has held above both since the April breakdown. Those two averages have merged into a tight support shelf around $0.0563–$0.0568, and the next upside checkpoint is the 100-day EMA near $0.07824.
- Medium to long-term outlook: For the AIA (DeAgentAI) price prediction 2026, reclaiming the 100-day EMA at $0.07824 is the level that would confirm a genuine trend change rather than a relief bounce. The 200-day EMA at $0.24152 remains the major long-term resistance, though it is falling steeply and will converge much lower by year-end.
- Technical analysis: The MACD line at 0.00179 sits above the signal line at 0.00042 with the histogram at 0.00137, and both lines are above the zero line. That is a cleaner momentum signal than most small-cap AI tokens are showing right now. The offsetting risk is RSI at 71.32 against its moving average at 53.80.
AIA (DeAgentAI) Short-Term Price Prediction – Today, This Week, July 2026
Here is the AIA price prediction 2026 for today, this week, and July 2026.
| Timeframe | Price Target | Support | Resistance | ROI |
| Next 24 Hrs | $0.0673 | $0.0619 | $0.0673 | +1.66% |
| This Week | $0.0720 | $0.0568 | $0.0720 | +8.76% |
| July 2026 | $0.0782 | $0.0568 | $0.0782 | +18.13% |
AIA (DeAgentAI) Price Prediction Today
AIA is trading near $0.0662 and could retest the session high at $0.0673 in the next 24 hours if buyers stay engaged. Immediate support sits at $0.0619, the day’s low, while a stretched RSI means a flat or slightly lower close would be a healthy outcome rather than a warning sign.
Trade Crypto in INR on 
Deposit and withdraw in INR (₹).
No Conversion to Crypto Required.

AIA (DeAgentAI) Coin Price Prediction for This Week
AIA is projected to trade between $0.0568 and $0.0720 this week. The token has cleared both its 20-day and 50-day EMAs, which turns the $0.0563–$0.0568 band into the first line of defence on any pullback. A daily close above $0.0720 would improve DeAgentAI’s short-term price outlook and put the 100-day EMA within reach. Losing $0.0568, on the other hand, would drop AIA back into the range it spent all of June grinding through.
AIA (DeAgentAI) Price Prediction for July 2026
The AIA (DeAgentAI) price prediction July 2026 targets $0.0782, within a range of $0.0568–$0.0782. The upper figure is the 100-day EMA, and it is the single most important level on this chart. AIA has not closed above it since early April, and reclaiming it would mark the first structural repair to the downtrend in four months. With about a week left in the month, a monthly close anywhere above $0.0720 would still count as a win for buyers. The caveat is the overbought RSI, which makes a mid-week consolidation between $0.0620 and $0.0700 the more probable path than a straight run.
Read more: How to buy Crypto in India
AIA (DeAgentAI) Coin Price Prediction for August 2026
DeAgentAI’s August 2026 price prediction targets $0.0880, with a range of $0.0782–$0.0880. If AIA clears the 100-day EMA and flips it to support, the path opens toward the $0.0880–$0.0980 pocket where price last consolidated in March. A sustained move above $0.0880 would improve the AIA coin price prediction for Q3 2026. Should the 100-day EMA reject price a second time, expect AIA to fall back into the $0.0568–$0.0782 range for another few weeks.
AIA (DeAgentAI) Price Prediction 2026 (Medium Term)
| Month | Price Target | Support | Resistance | ROI |
| July 2026 | $0.0782 | $0.0568 | $0.0782 | +18.13% |
| Aug 2026 | $0.0880 | $0.0673 | $0.0880 | +32.93% |
| Sep 2026 | $0.0980 | $0.0782 | $0.0980 | +48.04% |
| Oct 2026 | $0.1150 | $0.0880 | $0.1150 | +73.72% |
| Nov 2026 | $0.1450 | $0.0980 | $0.1450 | +119.03% |
| Dec 2026 | $0.1800 | $0.1150 | $0.1800 | +171.90% |
DeAgentAI’s 2026 price range is projected at $0.0563–$0.1800 based on the current EMA structure and the pace of the July recovery. The 20-day EMA at $0.05634 is the key short-term support. The 200-day EMA at $0.24152 is technically the major long-term resistance, but it is declining sharply from above $0.50 in April, so the practical ceiling for this year sits well below that number. For AIA to justify the upper end of this range, it needs to reclaim $0.07824 first and then hold above it through at least one monthly close. Until then, the AIA (DeAgentAI) price prediction stays constructive on momentum but cautious on trend, with the 2026 vesting cliff still ahead.
Want to diversify beyond DeAgentAI? Check out the Top 10 Cheapest Crypto Tokens to Invest in 2026
AIA (DeAgentAI) Price Prediction in INR (2026–2030)
For Indian traders, here is what the AIA (DeAgentAI) price prediction in INR looks like across the key horizons.
| Period | AIA Target USD | AIA Price INR est. |
| July 2026 | $0.0782 | ₹7.55 |
| December 2026 | $0.1800 | ₹17.37 |
| 2027 | $0.2200 | ₹21.23 |
| 2030 | $0.8000 | ₹77.20 |
INR estimates based on a USD/INR rate of ~₹96.5. Rate fluctuations will affect actual INR values; verify at the time of trade.
AIA (DeAgentAI) Long-Term Price Outlook (2027–2040)
The long-term outlook for AIA rests on three structural drivers: whether the DeAgent framework becomes a standard for verifiable AI agent execution, how cleanly the project absorbs the 39% of supply allocated to team and investors that begins vesting through 2029, and whether the ecosystem fund’s push into hardware and applications turns into revenue that feeds the token buyback mechanism.
The following forecasts are derived from network-adoption modelling, comparable AI-agent infrastructure valuations, and historical AIA volatility patterns. They represent scenario ranges, not price targets.
| Year | Price Target | Support | Resistance | ROI |
| 2027 | $0.2200 | $0.1500 | $0.3000 | +232.33% |
| 2028 | $0.3800 | $0.2400 | $0.5000 | +474.02% |
| 2029 | $0.5500 | $0.3600 | $0.7500 | +730.82% |
| 2030 | $0.8000 | $0.5500 | $1.1000 | +1,108.46% |
| 2031 | $1.0500 | $0.7000 | $1.4000 | +1,486.10% |
| 2035 | $1.9000 | $1.2000 | $2.7000 | +2,770.09% |
| 2040 | $3.2000 | $2.0000 | $4.5000 | +4,733.84% |
Where Will AIA (DeAgentAI) Price Go in 2030?
DeAgentAI’s 2030 price prediction targets $0.80, within a range of $0.55–$1.10. By then the three-year linear unlock schedule will have largely run its course, which removes the supply overhang that has defined AIA since listing. At $0.80 with the full billion tokens circulating, AIA would carry a fully diluted valuation near $800 million. That is demanding for an agent infrastructure protocol but not unprecedented, and it assumes the network is processing meaningful paid agent activity rather than trading on narrative alone.
Where Will AIA (DeAgentAI) Price Go in 2031?
The AIA price prediction for 2031 targets $1.05, with a range of $0.70–$1.40. Crossing $1.00 would put DeAgentAI’s fully diluted valuation at a billion dollars, a level that requires the protocol to be earning real fees. The metrics worth tracking are agent execution volume, the share of supply locked in the multi-pool staking programme, and how consistently the revenue buyback is actually executed.
Where Will AIA (DeAgentAI) Price Go in 2040?
By 2040, DeAgentAI’s price is projected at $3.20, ranging from $2.00 to $4.50, on the assumption that verifiable, on-chain AI agents become standard infrastructure rather than an experiment. Even the top of that band would leave AIA far below the $25.52 it printed on 7 November 2025, a figure set during a low-float squeeze and not a realistic reference point. These are 14-year projections carrying high uncertainty and should be read as scenario ranges, not fixed targets.
AIA (DeAgentAI) Technical Analysis
The following indicators were used to derive the AIA (DeAgentAI) price analysis above. Each value should be refreshed at the time of publishing.
| Indicator | Value | Signal |
| Relative Strength Index 14-Day RSI | 71.32 | Overbought |
| RSI Moving Average | 53.80 | Momentum expanding |
| 20-Day EMA | $0.05634 | Short-term support |
| 50-Day EMA | $0.05680 | Short-term support |
| 100-Day EMA | $0.07824 | Key resistance |
| 200-Day EMA | $0.24152 | Long-term resistance |
| MACD (12, 26, 9) | 0.00179 | Bullish, above zero |
| MACD Signal / Histogram | 0.00042 / 0.00137 | Momentum accelerating |
| Daily Trading Volume | 1.53M AIA | Moderate |
Relative Strength Index RSI
The 14-day RSI is at 71.32, just past the overbought threshold and roughly 17 points above its own moving average at 53.80. That spread confirms the rally has real force behind it, but it also means AIA is running hot. On this chart, the last two times RSI touched 70 the token pulled back within a week. The useful read here is not to short the strength but to expect consolidation, and to watch whether RSI holds above 50 on the retracement. If it does, the bullish AIA price prediction stays intact. A drop back below 45 would suggest the move has run its course.
Moving Averages 20-Day, 50-Day, 100-Day and 200-Day EMA
AIA is trading above both its 20-day EMA at $0.05634 and its 50-day EMA at $0.05680. Those two averages sitting almost on top of each other is worth noting, because a bullish cross between them would be the first since March. The token remains below the 100-day EMA at $0.07824 and well under the 200-day EMA at $0.24152, so the longer-term structure is still bearish. That said, this is a materially healthier picture than a month ago, when price was pinned beneath every average on the board. A close above $0.07824 would meaningfully strengthen the DeAgentAI coin price prediction for the months ahead.
MACD Moving Average Convergence Divergence
The MACD line at 0.00179 has crossed decisively above the signal line at 0.00042, with the histogram expanding to 0.00137. Crucially, both lines are above the zero line, which separates this setup from the countless small-cap bounces that fail while momentum stays negative. Traders using the AIA (DeAgentAI) price forecast as a framework should treat a histogram contraction, rather than a price dip alone, as the first sign the move is tiring.
Volume Analysis
AIA logged roughly 1.53 million tokens on the session, which is respectable but not exceptional against the spikes seen in May and early June. That is the weak link in an otherwise constructive setup. A breakout above $0.0782 on volume comparable to those earlier spikes would confirm institutional or at least sustained retail participation. A breakout on volume like today’s is more likely to fade, so watch turnover as closely as price at that level.
What Is the AIA (DeAgentAI) Price Prediction for Indian Traders?
At roughly ₹6.39 per AIA token today, the entry point against a 2030 base case of ₹77.20 implies a potential 12x over four years under the base scenario. AIA is a micro-cap ranked around #950 with a market capitalisation near $10 million against a fully diluted valuation of about $53 million, so position sizing matters far more here than on any large-cap asset.
One practical note before trading: DeAgentAI completed a 1:1 token migration, replacing its original BSC and Sui contracts with new ones. Anyone holding AIA from an older listing should confirm they are on the current contract.
FAQs
Q1. What will 1 AIA be worth in 2030?
Most price prediction models place 1 DeAgentAI (AIA) between $0.55 and $1.10 by 2030, with a base case near $0.80.
Q2. Is AIA a good investment in 2026?
Whether AIA is a good investment depends on your risk tolerance. DeAgentAI is a micro-cap token ranked around #950 with a market capitalization near $10 million and a fully diluted valuation close to $53 million, which means swings of 20% or more in a session are routine. The bull case rests on verifiable AI agents becoming necessary infrastructure and on the buyback mechanism working as designed. The bear case is the vesting schedule meeting thin liquidity.
Q3. Will AIA go up?
AIA has climbed roughly 40% off its all-time low of $0.04729, set on 24 June 2026, and has now cleared both its 20-day and 50-day EMAs, with MACD confirming above the zero line. Whether the move extends depends on the 100-day EMA at $0.07824. With RSI at 71.32, a short pause before that test would be normal and would not break the setup.
Q4. What is AIA's all-time high (ATH)?
DeAgentAI reached its all-time high of $25.52 on 7 November 2025, though that print came during an extreme low-float squeeze on very thin liquidity and is not a meaningful reference for future targets. The token now trades about 99.79% below that level. A more useful benchmark is the $0.50 area it held in early 2026. Its all-time low of $0.04729 was set much more recently, on 24 June 2026.
Q5. What is AIA used for?
The AIA token is used for paying for agent services and access, unlocking premium features, staking to support network operations and data validation, and governance over network parameters. A share of protocol revenue is also directed toward token buybacks, which is the mechanism that links usage to price.
Q6. How high will AIA go in 5 years?
By 2031, AIA price predictions range from $0.70 to $1.40, with a base case near $1.05.
Q7. What is the AIA (DeAgentAI) price prediction for 2026 in INR?
At a December 2026 target of $0.18 and a USD/INR rate near ₹96.5, AIA could trade around ₹17.37 by year-end 2026.
Q8. What will AIA be worth in 2040?
Long-term adoption models project DeAgentAI between $2.00 and $4.50 by 2040, with a base case near $3.20. These are high-uncertainty scenario ranges over a 14-year horizon and depend on the project holding its position against competing AI agent frameworks.
Disclaimer
This article is for informational purposes only and does not constitute financial or investment advice. Digital asset markets are highly volatile and prices can change rapidly. Past performance is not indicative of future results. The price predictions above are based on technical and on-chain analysis and should not be construed as investment recommendations. Always conduct your own research before making any trading or investment decisions.