
Caldera crypto price prediction explores ERA price targets from 2026 to 2040, covering daily, weekly, monthly, and long-term forecasts. Analyse potential price movements using key support and resistance levels, RSI, MACD, and moving averages. The forecast also examines ERA’s technical momentum, projected 2026 price range, and possible future scenarios for 2030 and beyond based on current market trends and chart patterns.
Caldera (ERA) is currently trading at $0.1001, reflecting a bullish market sentiment as of 21 July 2026. The 14-day RSI stands at 53.27, signalling neutral conditions, while the 50-day and 200-day moving averages are positioned at $0.0985 and $0.0851, respectively. The MACD is positive, indicating bullish short-term momentum. Based on these technical indicators and broader market trends, ERA is expected to consolidate above the $0.0985 support zone while potentially testing resistance near $0.1100 in the near term.
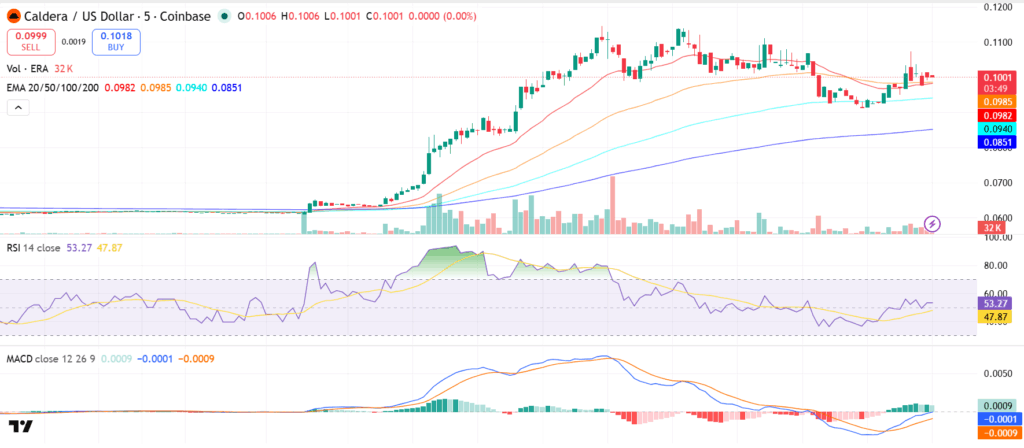
ERA/USD, Source TradingView
Key Insights
● This week: ERA may trade in the $0.0940-$0.1100 range, with momentum remaining mildly bullish while the price holds above the 50-day EMA.
● July 2026: The token could target around $0.1030, with a broader range of $0.0850-$0.1150 as traders watch the $0.1100 resistance and $0.0850 support zones.
● 2026-2030: ERA’s longer-term price path will depend on sustained ecosystem growth, liquidity, and token supply dynamics. The ERA Token Unlock schedule remains an important factor to monitor, as additional token supply entering circulation could influence price volatility.
● Technical analysis: ERA is above its 20-day EMA ($0.0982) and 50-day EMA ($0.0985), while the RSI at 53.27 remains neutral. The positive MACD histogram suggests improving short-term momentum.
Caldera Short-Term Price Prediction – Today, This Week, July 2026
Here is the Caldera ERA Coin price prediction 2026 for today, this week, and July 2026.
| Timeframe | Price Target | Support | Resistance | ROI |
| Next 24 Hrs | $0.1020 | $0.0985 | $0.1060 | +1.90% |
| This Week | $0.1040 | $0.0940 | $0.1100 | +3.90% |
| July 2026 | $0.1030 | $0.0850 | $0.1150 | +2.90% |
Caldera Price Prediction Today
Caldera is trading at $0.1001 and is expected to range between $0.0985 and $0.1060 in the next 24 hours. The RSI sits at 53.27 and the 20-day EMA at $0.0982 signals mildly bullish short-term momentum. A hold above $0.0985 targets $0.1060; a break below risks a drop towards $0.0940.
Trade ERA in INR on 
Deposit and withdraw in INR (₹).
No Conversion to Crypto Required.

Caldera Coin Price Prediction for This Week
Caldera is projected to trade between $0.0940 and $0.1100 for the week of 21-27 July 2026. ERA is above the 50-day EMA at $0.0985, with the MACD histogram turning positive, pointing to improving bullish momentum. A weekly close above $0.1100 opens the way towards $0.1150; a loss of $0.0940 targets $0.0850.
Caldera Price Prediction for July 2026
Caldera’s July 2026 price prediction targets $0.1030, with a range of $0.0850-$0.1150. ERA is above its 200-day MA at $0.0851, and the available RSI reading of 53.27 signals neutral conditions. A monthly close above $0.1100 would strengthen bullish momentum heading into August 2026.
New to Caldera? Read our guide on how to buy ERA token in CoinDCX
Caldera Coin Price Prediction for August 2026
Caldera’s August 2026 price prediction targets $0.1080, with a range of $0.0900-$0.1200. ERA is above its 200-day MA at $0.0851, and the available RSI reading of 53.27 signals neutral conditions. A sustained move above $0.1150 could strengthen bullish momentum heading into Q3 2026.
Caldera Price Prediction 2026 (Medium Term)
| Month | Price Target | Support | Resistance | ROI |
| July 2026 | $0.1030 | $0.0850 | $0.1150 | +2.90% |
| Aug 2026 | $0.1080 | $0.0900 | $0.1200 | +7.90% |
| Sep 2026 | $0.1100 | $0.0950 | $0.1250 | +9.90% |
| Oct 2026 | $0.1060 | $0.0900 | $0.1200 | +5.90% |
| Nov 2026 | $0.1120 | $0.0950 | $0.1300 | +11.90% |
| Dec 2026 | $0.1180 | $0.1000 | $0.1350 | +17.90% |
Caldera’s 2026 price range is projected at $0.0850-$0.1350, based on the price structure and technical levels visible in the provided charts. The 200-day MA at $0.0851 is the key bull/bear line — a hold above this level could support a move towards $0.1150-$0.1350, while a break below the $0.0850 support zone risks a drop towards $0.0700. The available MACD is positive and RSI is above the midline, suggesting improving short-term momentum. The ERA Token Unlock schedule should also be monitored, as changes in circulating supply may affect market dynamics and price volatility.
Caldera Price Prediction 2026 to 2040 (Long Term)
| Year | Price Target | Support | Resistance | ROI |
| 2027 | $0.1350 | $0.1050 | $0.1550 | +34.87% |
| 2028 | $0.1550 | $0.1200 | $0.1800 | +54.85% |
| 2029 | $0.1750 | $0.1350 | $0.2100 | +74.83% |
| 2030 | $0.2000 | $0.1500 | $0.2400 | +99.80% |
| 2031 | $0.2200 | $0.1650 | $0.2600 | +119.78% |
| 2035 | $0.3500 | $0.2500 | $0.4500 | +249.65% |
| 2040 | $0.5000 | $0.3500 | $0.6500 | +399.50% |
Caldera 2030 Forecast: What Is the Expected Price?
Caldera price prediction 2030 targets $0.2000, within a range of $0.1500-$0.2400, based on a scenario of continued price appreciation from the current $0.1001 level and sustained market momentum. The provided charts show ERA trading above its 50-day EMA of $0.0985 and 200-day EMA of $0.0851, while the RSI remains neutral at 53.27. These technical conditions provide the basis for a longer-term bullish scenario, although the 2030 projection carries significant uncertainty.
Caldera 2031 Outlook and Expected Price Range
The Caldera price outlook for 2031 targets $0.2200, with a range of $0.1650-$0.2600, assuming the longer-term upward trend remains intact. The current chart structure shows ERA holding above its 20-day EMA ($0.0982), 50-day EMA ($0.0985), and 200-day EMA ($0.0851). Future price performance will depend on whether the token can maintain this broader technical structure and build sustained momentum above the $0.1100 resistance area.
Caldera price prediction 2040: Long-Term Forecast
By 2040, Caldera’s Caldera price forecast is projected at $0.5000, ranging from $0.3500 to $0.6500 under a long-term bullish scenario. This projection represents a significant increase from the current chart price of $0.1001 and assumes continued ecosystem development and sustained market demand. However, the provided charts contain no fundamental or long-term adoption data, so these figures should be viewed strictly as scenario ranges rather than fixed targets.
Caldera Technical Analysis
The following technical indicators were used to derive the price predictions above. Each indicator’s value and signal should be updated at the time of publishing.
| Indicator | Value | Signal |
| Relative Strength Index (14-Day RSI) | 53.27 | Neutral |
| 50-Day Moving Average | $0.0985 | Bullish |
| 200-Day Moving Average | $0.0851 | Bullish |
| MACD | -$0.0001 | Bullish |
| MACD Histogram | $0.0009 | Positive |
| Average Trading Volume (7-Day) | 32K ERA | Increasing |
Relative Strength Index (RSI)
The 14-day RSI is at 53.27, signalling neutral (30-70) conditions. The indicator is positioned above the 50 midline but remains well below the overbought threshold of 70. This suggests that ERA currently has room to move in either direction, with the next significant price catalyst likely determining the short-term trend.
Moving Averages (50-Day & 200-Day MA)
ERA is above its 50-day MA at $0.0985 and above its 200-day MA at $0.0851. The price at $0.1001 is also above the 20-day EMA at $0.0982 and the 100-day EMA at $0.0940. Trading above all four displayed moving averages indicates a bullish technical alignment, although the relatively close positioning of the 20-day and 50-day averages suggests that short-term consolidation remains possible.
MACD (Moving Average Convergence Divergence)
The MACD is shown at approximately -0.0001, while the signal line is around -0.0009, with a histogram of approximately 0.0009. The MACD line is therefore above the signal line, indicating bullish short-term momentum. The positive histogram supports the possibility of continued upside momentum, although the relatively small values suggest that the momentum signal remains moderate rather than strong.
Volume Analysis
Caldera’s available chart shows a recent trading volume reading of approximately 32K ERA, with volume activity increasing around recent price movements. The rise in volume accompanying the broader move from approximately $0.0615 towards the $0.1000-$0.1100 area suggests stronger market participation.
Disclaimer: This article is for informational purposes only and does not constitute financial or investment advice. Crypto markets are highly volatile. Always do your own research (DYOR) before making any investment decisions.