

The Kaito crypto price prediction analyzes current price action using RSI, MACD, and moving averages to estimate short-, medium-, and long-term trends. This forecast covers today’s outlook, weekly expectations, monthly projections, and price targets from 2026 to 2040. It also highlights key support and resistance levels, helping traders and investors understand potential market direction based on the latest technical indicators and chart patterns.
Kaito (KAITO) is currently trading at $1.2854, reflecting a neutral market sentiment as of July 28, 2026. The 14-day RSI stands at 48.10, signaling neutral conditions, while the 50-day and 200-day moving averages are positioned at $1.2872 and $1.2647, respectively. The MACD is negative, indicating bearish short-term momentum. Based on these technical indicators and broader market trends, KAITO is expected to consolidate between $1.2750 and $1.2920 in the near term, with a breakout above resistance needed for a stronger move higher.
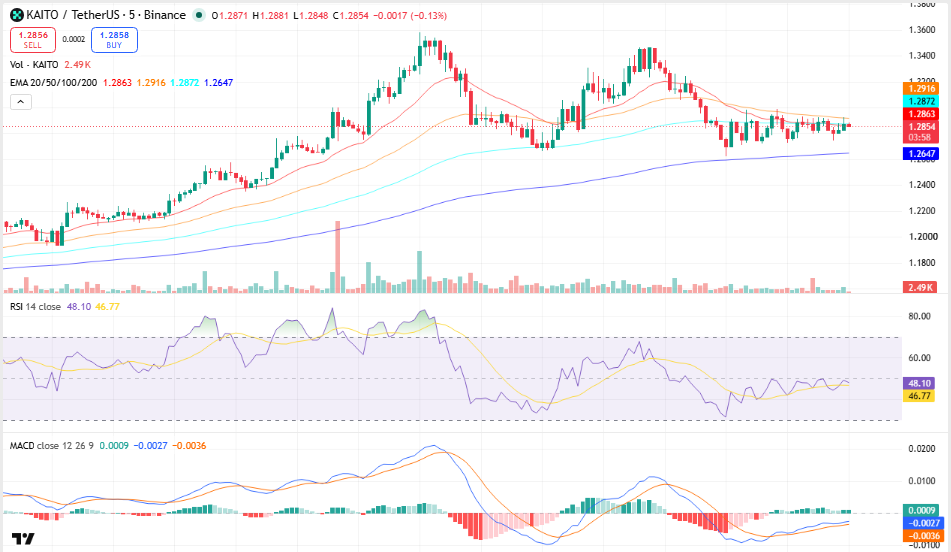
KAITO/USDT, Source TradingView
Key Insights
- Weekly & Monthly Outlook: KAITO is likely to remain range-bound this week, while August 2026 could see a retest of the $1.31 resistance if buyers regain momentum.
- Long-Term Outlook: The broader trend remains constructive above the 200-day EMA, supporting gradual upside into 2026 and potential higher valuations by 2030.
- Technical Analysis: RSI at 48.10 is neutral, while a slightly negative MACD suggests momentum remains weak until resistance is reclaimed.
Kaito Short-Term Price Prediction – Today, This Week, August 2026
Here is the Kaito price prediction 2026 for today, this week, and August 2026.
| Timeframe | Price Target | Support | Resistance | ROI |
| Next 24 Hrs | $1.2900 | $1.2780 | $1.2920 | +0.36% |
| This Week | $1.3000 | $1.2720 | $1.3050 | +1.14% |
| August 2026 | $1.3200 | $1.2650 | $1.3400 | +2.69% |
Kaito Price Prediction Today
Kaito is trading at $1.2854 and is expected to range between $1.2780 and $1.2920 in the next 24 hours. The RSI sits at 48.10 and the 20-EMA at $1.2863 signals neutral-to-bearish short-term momentum. A hold above $1.2780 targets $1.2900; a break below risks a drop to $1.2650.
Trade KAITO in INR on 
Deposit and withdraw in INR (₹).
No Conversion to Crypto Required.

Kaito Coin Price Prediction for This Week
Kaito is projected to trade between $1.2720 and $1.3050 for the week of July 28-August 3, 2026. KAITO is below the 50-day EMA at $1.2872, with the MACD histogram contracting, pointing to bearish momentum. A weekly close above $1.3050 opens $1.3200; a loss of $1.2720 targets $1.2650.
Kaito Price Prediction for August 2026
Kaito’s August 2026 price prediction targets $1.3200, with a range of $1.2650-$1.3400. KAITO is above its 200-day MA at $1.2647, and the monthly RSI at 48.10 signals neutral conditions. A monthly close above $1.3400 would confirm bullish momentum in Q3 2026.
Kaito Coin Price Prediction for September 2026
Kaito’s September 2026 price prediction targets $1.3500, with a range of $1.2900-$1.3700. KAITO is above its 200-day MA at $1.2647, and the monthly RSI at 48.10 signals neutral conditions. A monthly close above $1.3700 would confirm bullish momentum in Q3 2026.
Kaito Price Prediction 2026 (Medium Term)
| Month | Price Target | Support | Resistance | ROI |
| Aug 2026 | $1.3200 | $1.2650 | $1.3400 | +2.69% |
| Sep 2026 | $1.3500 | $1.2900 | $1.3700 | +5.03% |
| Oct 2026 | $1.3800 | $1.3200 | $1.4000 | +7.36% |
| Nov 2026 | $1.4100 | $1.3400 | $1.4300 | +9.70% |
| Dec 2026 | $1.4500 | $1.3700 | $1.4800 | +12.03% |
Kaito’s 2026 price range is projected at $1.2650-$1.4500, driven by its current technical structure. The 200-day MA at $1.2647 is the key bull/bear line—a hold above targets $1.4500, while a break below $1.2650 risks a drop toward $1.2400. Weekly MACD is negative and RSI is trending below the midline.
Kaito Price Prediction 2026 to 2040 (Long Term)
| Year | Price Target | Support | Resistance | ROI |
| 2027 | $1.60 | $1.40 | $1.75 | +24.47% |
| 2028 | $1.95 | $1.70 | $2.10 | +51.70% |
| 2029 | $2.30 | $2.00 | $2.50 | +78.92% |
| 2030 | $2.80 | $2.40 | $3.00 | +117.83% |
| 2031 | $3.20 | $2.80 | $3.50 | +148.95% |
| 2035 | $5.20 | $4.60 | $5.80 | +304.55% |
| 2040 | $8.50 | $7.50 | $9.50 | +561.26% |
Kaito 2030 Forecast: What Is the Expected Price?
Kaito price prediction 2030 targets $2.80, within a range of $2.40-$3.00, supported by the current long-term uptrend above the 200-day moving average and improving market participation. Based on the available technical structure, a sustained move above long-term resistance would strengthen the bullish outlook, while failure to hold support could delay upside momentum.
Kaito 2031 Outlook and Expected Price Range
The Kaito price outlook for 2031 targets $3.20, with a range of $2.80-$3.50. Price action is expected to build on the long-term trend established during 2030, provided KAITO continues trading above its major moving averages. A sustained hold above support would favor gradual appreciation, while weakness below support could lead to extended consolidation.
Kaito price prediction 2040: Long-Term Forecast
The Kaito price forecast for 2040 projects an average price of $8.50, with a range of $7.50-$9.50. The long-term technical trend remains constructive as long as the price stays above the major moving averages. These projections should be viewed as scenario-based estimates and not guaranteed price targets.
Kaito Technical Analysis
The following technical indicators were used to derive the price predictions above. Each indicator’s value and signal should be updated at the time of publishing.
| Indicator | Value | Signal |
| Relative Strength Index (14-Day RSI) | 48.10 | Neutral |
| 50-Day Moving Average | $1.2872 | Bearish |
| 200-Day Moving Average | $1.2647 | Bullish |
| MACD | -0.0027 | Bearish |
| MACD Histogram | -0.0036 | Negative |
| Average Trading Volume (24H) | $8.17M | Decreasing |
Relative Strength Index (RSI)
The 14-day RSI is at 48.10, signaling neutral (30-70) conditions. The indicator reflects market indecision, suggesting the next major catalyst will likely determine KAITO’s short-term direction.
Moving Averages (50-Day & 200-Day MA)
KAITO is below its 50-day MA at $1.2872 and above its 200-day MA at $1.2647. This indicates a short-term pullback within a broader uptrend, with the 50-day moving average acting as immediate resistance.
MACD (Moving Average Convergence Divergence)
The MACD is below the signal line with a histogram of -0.0036, indicating bearish momentum. The converging MACD lines suggest bearish momentum is weakening and a directional breakout could occur over the next several sessions.
Volume Analysis
Kaito’s 24-hour trading volume is approximately $8.17 million. Current trading activity appears decreasing, indicating weaker conviction behind recent price movements and favoring consolidation until stronger volume returns.
Disclaimer: This article is for informational purposes only and does not constitute financial or investment advice. Crypto markets are highly volatile. Always do your own research (DYOR) before making any investment decisions.


