


Macro Overview:
The week’s US inflation data for April 2022 showed a slight dip in the annual rate to 4.9%, lower than economists’ expectations of 5% and the lowest level since November 2021. This suggests that the Federal Reserve’s interest rate increases are having a positive effect in controlling price rises, which is a step in the right direction.
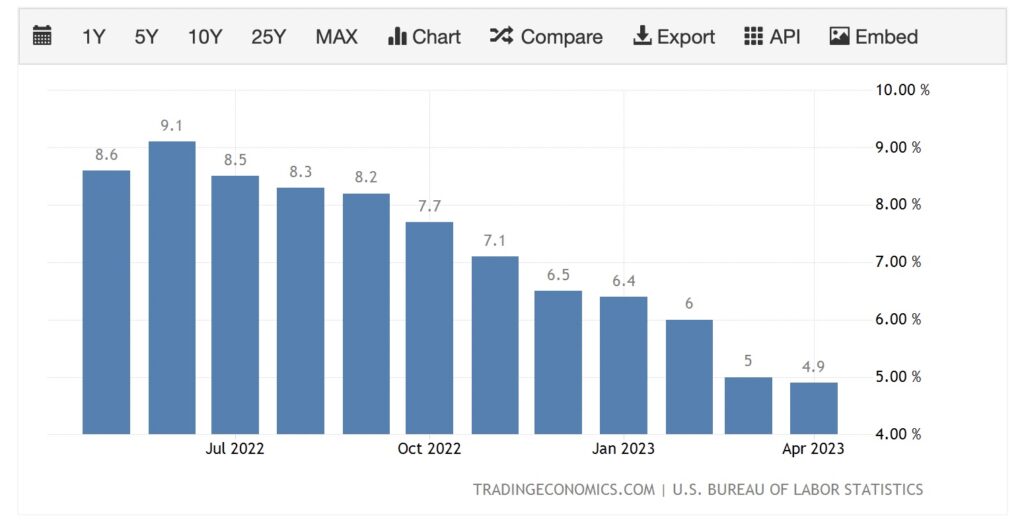 However, it is important to note that core inflation and core services are still rising at a solid pace, indicating that inflationary pressures remain. Overall, the data provides a cautiously optimistic outlook for the US economy in terms of inflation control, but the Federal Reserve will continue to closely monitor price trends and adjust monetary policy accordingly.
Crypto Market Overview:
Bitcoin price slips down from $28,000 grounds
In our previous State of the Market Report (dated 5th May), we highlighted the risk of upcoming potential downfall as Spot Markets were selling and price action looked bleak. And this week turned out the way we analyzed. BTC is currently trading at $26,350 with massive long liquidation and removal of open interest ongoing. Also, to correlate to the data that month of May has been seen as RED in the history of Crypto Markets.
As the price action follows, we are still seeing more and more Spots (analyzed via Cumulative Volume Delta of global exchanges) sell-offs in the market and can see it to subside with the demand somewhere around $24,500-$25,400.
Bitcoin: Technical Analysis
Source: Tradingview
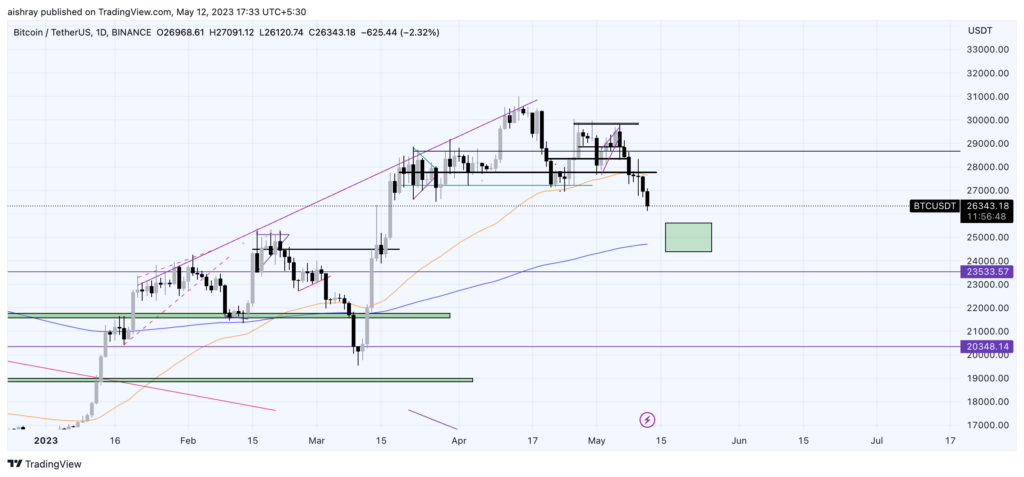
Upon analyzing the chart, it is evident that BTC has broken the support levels of $27,700, leading to high volatility and massive liquidations flooding the market on Wednesday during the release of CPI data. Currently, the BTC has broken the 55 EMA (yellow line) and support at $27,200, and is trading at $26,300. The price action appears to be heavily bearish and heading towards the 200 EMA (Blue Line) at $25,000, which could act as a support since it was a resistance level in mid-February 2023. The chart also indicates a potential upside retest for $27,200, with a 3% increase expected next week before heading towards the 200 EMA.
Overall, the numbers on the chart point towards a bearish trend for BTC, with potential support levels and a slight rebound in the short term.
Ethereum: Technical Analysis
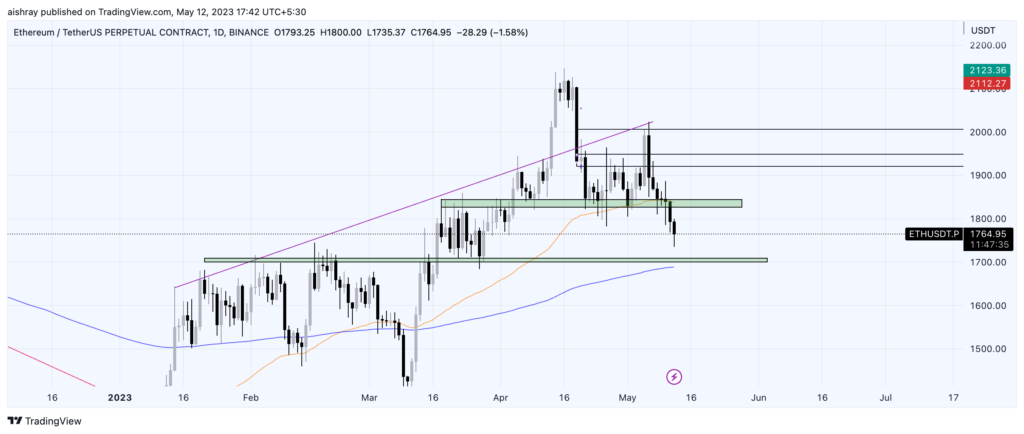
ETH seems to be following the same trend as Bitcoin and the general market. Recently, a major support zone at $1820-$1840 broke downwards, which was a 55 EMA and horizontal support. With the bearish trend established, it is expected that prices will continue to fall towards the 200 EMA and horizontal support levels of $1700. However, there is a possibility of a short-term upside retest from the current price of $1760, which could lead to a rebound towards $1880. Overall, the numbers on the chart suggest a bearish outlook for ETH, with potential support levels and a slight upward movement in the short term.
Disclaimer:
Crypto products and NFTs are unregulated and can be highly risky. There may be no regulatory recourse for any loss from such transactions. The Content is for informational and educational purposes only. The Content is not an offer, or solicitation of an offer, to invest in, or to buy or sell any interest or securities or virtual digital assets or to participate in any investment or trading strategy.The Content or any part of it is not legal, financial, investment or tax advice. The calculations, data, risk return formulations, performance or market capitalization indicators are based on the independent data sourced by CoinDCX or third parties. Past performance is not indicative of any future results.
